Institute for Agricultural Research,
Ahmadu Bello University,
P.M.B 1044
Zaria.
INSTITUTE FOR AGRICULTURAL RESEARCH (IAR) SAMARU AHMADU BELLO UNIVERSITY ZARIA
LAND EVALUATION OF AHMADU BELLO UNIVERSITY FARM, SHIKA ZARIA
FINAL REPORT
DEPARTMENT OF SOIL SCIENCE FACULTY OF AGRICULTURE/ INSTITUTE FOR AGRICULTURAL RESEARCH, ABU ZARIA
DECEMBER, 2024
It is my privilege to present this comprehensive report on the Land Evaluation of Ahmadu Bello University Farm, Shika, Zaria. This study was commissioned to provide a detailed assessment of the soil and land resources within the university farm, with the aim of enhancing agricultural productivity, optimizing land use, and promoting sustainable farming practices.
The ABU Research Farm in Shika is a vital resource for the university, serving as a hub for practical agricultural research, teaching, and innovation. Understanding the soil characteristics, fertility status, and suitability for various crops is essential for maximizing the farm's potential and ensuring its long-term sustainability. This report is the culmination of an extensive soil survey conducted by a team of dedicated soil scientists and researchers from the Department of Soil Science, Faculty of Agriculture, and the Institute for Agricultural Research. Their meticulous fieldwork, laboratory analyses, and data interpretation have provided invaluable insights into the soil properties, land capability, and irrigation suitability of the farm.
The findings of this study are not only critical for the university's agricultural programs but also serve as a valuable resource for farmers, policymakers, and stakeholders in the agricultural sector. The report highlights the importance of tailored soil management practices, irrigation strategies, and crop selection to optimize productivity while preserving the natural resource base. It also underscores the need for continuous monitoring and adaptive management to address emerging challenges such as climate variability, soil degradation, and water resource management.
I would like to extend my gratitude to the team of researchers who conducted this study, as well as the university administration for their support and commitment to advancing agricultural research. Special thanks are also due to the technical staff and field assistants whose contributions were instrumental in the successful completion of this project. It is my hope that this report will serve as a foundational document for future research, policy formulation, and practical interventions aimed at improving agricultural productivity and sustainability in the region.
Professor Ado A. Yusuf
Executive Director
Institute for Agricultural Research
Ahmadu Bello University, Zaria
The successful completion of the Detailed Soil Survey and Land Evaluation at ABU Farm was achieved through the unwavering dedication and collaboration of a highly skilled team of professionals and support staff.
We sincerely appreciate Prof. Ado A. Yusuf, the Executive Director of the Institute for Agricultural Research (IAR), for his visionary leadership in initiating and sponsoring the Land Evaluation of the IAR and ABU Research Farms. This project would not have been possible without his unwavering support and commitment to advancing agricultural research and development.
We express our profound gratitude to Prof. Nafiu Abdu, Deputy Director and Project Leader (Quality Assurance), for his exemplary leadership and steadfast commitment to upholding the highest standards throughout the project. His invaluable guidance was instrumental in ensuring the accuracy and reliability of this study.
We are deeply indebted to the Head of the Department of Soil Science (Prof. Aisha Abdulkadir) whose guidance and encouragement were invaluable throughout this work.
We sincerely appreciate the invaluable contributions of Prof. Yau S.L., Dr. Maniyunda, L. M., Dr. Shobayo, A.B., Dr. Jamila Aliyu, and Mrs. Ummusalma S.Z., who played crucial roles as Pedologists and Soil Surveyors specializing in Land Use Planning. Their expertise, dedication, and meticulous field assessments significantly enhanced the precision and depth of our findings.
A special acknowledgment goes to the technical staff, Mr. Bitrus A. Kantiok and Mr. Abdulazeez Ridwan, for their expertise in conducting infiltration assessments. Their contributions were essential in evaluating the soil's hydraulic properties, thereby enriching the study.
We also recognize and deeply appreciate the hard work of our field assistants, Mal. Jamilu Ilyasu and Mal. Umar Lawal, whose diligence and commitment ensured efficient data collection and seamless field operations.
Additionally, we extend our sincere appreciation to Mal. Adamu Abubakar, our driver, for his unwavering logistical support, which played a vital role in the smooth execution of field activities.
This report stands as a testament to the collective expertise and dedication of all team members, whose contributions have significantly deepened our understanding of soil characteristics and land suitability at ABU Farm. We are profoundly grateful for their efforts in advancing soil science and sustainable land management.
Prof, Nafiu Abdu
Deputy Director/Team Leader
Institute for
Agricultural Research, Samaru
Ahmadu Bello University, Zaria
2.0 PHYSICAL SETTING OF THE SURVEY AREA
2.1.1 Location of the survey area
2.3.1 The rainfall trend in Zaria
2.3.2 Temperature variability in Zaria
2.3.3 Relative humidity trend in Zaria
2.3.4 Sunshine hours changes across decades in Zaria
3.3 Preparation of Base Map for Fieldwork
4.1.1 Morphological Properties of the ABU1
4.1.1.1 Horizon Boundary Characteristics
4.1.2 Physical Properties of ABU1 Soil Unit
4.1.2.3 Hydraulic Conductivity (K sat)
4.1.2.4 Soil Available Moisture (SAM)
4.1.3 Chemical Properties of the ABU1 Soil Unit
4.1.3.3 Available Phosphorus (AP)
4.1.3.5 Electrical Conductivity (ECe)
4.1.3.7 Cation Exchange Capacity (CEC)
4.1.3.8 Effective Cation Exchange Capacity (ECEC)
4.1.3.10 Sodium Adsorption Ratio (SAR)
4.1.3.11 Exchangeable Acidity (EA)
4.1.3.12 Salinity Indicators: Bicarbonates and Chlorides
4.2.1 Morphological Properties of the ABU2 Soil Unit
4.2.1.1 Soil Structure and Horizon Transitions
4.2.2 Physical Properties of the ABU2 Soil Unit
4.2.2.3 Hydraulic Conductivity (K_sat)
4.2.2.4 Soil Available Moisture (SAM)
4.2.2.5 Available Water Capacity (AWC)
4.2.3 Chemical Properties of the ABU2 Soil Unit
4.2.3.2 Electrical Conductivity (Ece)
4.2.3.4 Exchangeable Acidity (EA)
4.2.3.5 Total Exchangeable Bases (TEB)
4.2.3.6 Percent Base Saturation (PBS)
4.2.3.7 Effective Cation Exchange Capacity (ECEC)
4.2.3.8 Bicarbonate (HCO3⁻) and Chloride (Cl⁻)
4.3.1 Morphological Properties of the ABU Farm, Soil Unit ABU3
4.3.1.1 Soil Structure and Horizon Transitions
4.3.2 Physical Properties of the ABU Farm Soil Unit ABU3
4.3.2.3 Hydraulic Conductivity (K_sat)
4.3.2.4 Soil Available Moisture (SAM)
4.3.2.5 Available Water Capacity (AWC)
4.3.3 Soil Chemical Properties
4.3.3.1 Soil reaction (pH water and pHCaCl2)
4.3.3.2 Electrical Conductivity (Ece)
4.3.3.5 Available Phosphorus (AP)
4.3.3.7 Total Exchangeable Bases (TEB)
4.3.3.8 Cation Exchange Capacity (CEC)
4.3.3.9 Percent Base Saturation (PBS)
4.3.3.11 Bicarbonate (HCO3⁻) and Chloride (Cl⁻)
4.4.1 Morphological Properties of the ABU Farm Soil Unit ABU4
4.4.1.1 Depth and Structural Properties
4.4.2 Physical Properties of ABU Farm, Soil Unit ABU 4
4.4.2.3 Hydraulic Conductivity (K_sat)
4.4.2.4 Soil Available Moisture (SAM)
4.4.2.5 Available Water Capacity (AWC)
4.4.3 Chemical Properties of ABU Farm, Soil Unit ABU4
4.4.3.2 Organic carbon (OC) and Total Nitrogen (TN)
4.4.3.3 Exchangeable Cations and Base Saturation
4.4.3.4 Salinity and Sodicity Indicators
4.5.1 Morphological Properties of the ABU Farm, Soil Unit ABU5
4.5.2 Physical Properties of the ABU Farm, Soil Unit ABU5
4.5.2.3 Hydraulic Conductivity (K_sat)
4.5.2.4 Soil Available Moisture (SAM)
4.5.2.5 Available Water Capacity (AWC)
4.5.3 Chemical Properties of the ABU Farm, Soil Unit ABU5
4.5.3.1 Soil reaction and Electrical conductivity
4.5.3.2 Organic carbon, Total Nitrogen, Available Phosphorus
4.5.3.3 CEC, TEB, PBS, ESP and SAR
5.0 SPATIAL DISTRIBUTION AND FERTILITY ASSESSMENT OF SOIL PROPERTIES
6.1 The Land Capability Classification
7.0 DESCRIPTION OF WATER FOR IRRIGATION
8.0 CONCLUSION AND RECOMMENDATION
Table 4.1 Extent of the soil mapping units in the survey area
Table 4.2 Physical properties of soil mapping units Of ABU Farm, Shika, Zaria survey area 28
Table 4.3 Chemical properties of the soil mapping units
Table 4.4 : Infiltration Rates54
Table 4.5 Soil classification of ABU Farm Shika survey area
Table 6.1: Description and Area Extent of Land Capability Classes of ABU Farm
Table 6.2: Irrigation Land Suitability Index and Classes for ABU Farm69
Figure 2: Rainfall trends in Zaria
Figure 3: Time series of average monthly temperature in Zaria
Figure 4: Mean monthly relative humidity in IAR Zaria
Figure 5: Sunshine hours trends in Zaria from 1984-2023
Figure 4.1: Depth characteristics of the soil mapping units
Figure 4.2: Depth function of soil textural classes of the soil mapping units
Figure 4.3: Depth function of soil colour matrices of the soil mapping units
Figure 4.4: Distribution of soil physical properties
Figure 4.5: Scatter plot matrix for soil physical properties vs OC and CEC
Figure 4.6: Depth function of OC, TN and AP by horizon
Figure 4. 7: pH changes with depth across horizons
Figure 4.8: Exchangeable bases levels
Figure 4.9: Depth distribution of exch. Acidity, SAR, carbonate, and chloride ions.
Figure 4.10: Particle size distribution of soil unit 2
Figure 4.11: Depth function of BD, PD, K-sat, and TP of soil unit 2
Figure 4.12: Infiltration curve for ABU1
Figure 4.13: Infiltration curve for ABU 2
Figure 4.14: Infiltration curve for ABU3
Figure 4.15: Infiltration curve for ABU 4
Map 3.1: Basemap with grids and auger observation/sampling points of ABU Farm
Map 4.1: Soil Map of ABU Farm Shika Zaria
Map 6.1: Land Capability of Map of ABU Farm Shika Zaria
Map 6.2: Map of the Land Suitability Subclasses for Gravity Irrigation System ABU Farm
Map 6.3: Maize suitability classes of ABU Farm Shika Zaria
Map 6.4: Sorghum suitability classes of ABU Farm Shika Zaria
Map 6.5: Soybean suitability classes of ABU Fram Shika Zaria
Map 6.6: Cowpea suitability classes of ABU Farm Shika Zaria
APPENDIX A: ABU farm Soil Profile Morphological Description
APPENDIX B1 Physiographic and Morphological Properties of ABU farm, Shika
APPENDIX B2: Physical and Chemical Properties of Top 0-30cm Auger Points
APPENDIX B3 Chemical Properties of Top 0 – 30 cm Auger Points
APPENDIX C: AHP (Pairwise comparison table) FOR MAIZE
APPENDIX D: AHP (Pairwise comparison table) FOR SORGHUM
APPENDIX E: AHP (Pairwise comparison table) FOR SOYBEAN
APPENDIX F1: AHP (Pairwise comparison table) FOR COWPEA
APPENDIX G: Spatial Distribution of soil properties in ABU Farm, Shika
.
ABU: Ahmadu Bello University Zaria
AAS: Atomic absorption spectrophotometer
AP: Available phosphorus
CEC: Cation exchange capacity
DEM: Digital Elevation Models
ECe: Electrical conductivity of soil paste
ESP: Exchangeable sodium percentage
FAO: Food and Agriculture Organization
GIS: Geographical Information Service
GPS: Global Positioning System
IAR: Institute for Agricultural Research Samaru
IDZ: Inter tropical Discontinuity Zone
ILSC: Irrigation Land Suitability Classification
IUSS: International Union of Soil Science
LCC: Land Capability Classification
OC: Organic carbon
PBS: Percent base saturation
SAR: Sodium adsorption ratio
TEB: Total exchangeable bases
TN: Total Nitrogen
TOR: Terms of Reference
UNESCO: United Nation Educational Scientific and Cultural Organization
USDA: United State Department of Agriculture
WRB: World Reference Base of Soil Resources
A detailed soil survey of the Ahmadu Bello University farm Shika, covering 404.35 ha at a scale of 1:13,500 was conducted to provide baseline data for land suitability evaluation. Five major soil mapping units were identified (ABU 1 to ABU 5), with ABU 1 being the largest (229.96 ha, 56.87%) and ABU 4 the smallest (13.62 ha, 3.37%). The soils were characterized based on morphological, physical and chemical properties, revealing that most soils were deep, with textures varying from silty loam to clay. However, ABU 5 was shallow, with exposed ironstone and plinthite. Drainage ranged from well-drained to poorly drained in units ABU 3 and ABU 4. Soil pH varied from strongly acidic to neutral, and most soils were non-saline and non-sodic, though salt build-up may need to be monitored under intensive irrigation. Organic carbon and total nitrogen levels were low, cation exchange capacity was medium to high, and base saturation was high. The soils were classified using USDA Soil Taxonomy, FAO/UNESCO World Reference Base systems. Based on FAO/UNESCO classification, soils in ABU 2 and ABU 4 were classified as Plinthosols, ABU 5 as Petric Plinthosols, ABU 1 as Haplic Luvisols, and ABU 3 as Fluvic Gleysols. Land capability classes varied from Class I (ABU 2) to Class VI (ABU 5), with ABU 1 classified as IIs. Irrigation suitability was highest for ABU 1 and ABU 2 (class S1), while ABU 3 and ABU 4 were restricted (R), and ABU 5 was classified as non-irrigable (class 6). Limiting factors included poor drainage, nutrient status, and low workability. The multicriteria decision-making method (AHP) was used to assess crop suitability for maize, sorghum, soybean, and cowpea by highlighting the most critical factors influencing each crop. For maize, soil texture (0.3285) and organic carbon (OC) (0.2744) are key to optimizing root penetration and fertility respectively while, sorghum heavily depends on rainfall (0.3713) and temperature (0.2657) due to its sensitivity to climatic conditions. Soybean prioritizes drainage (0.4659) to prevent waterlogging, followed by slope (0.2772) to manage erosion. Similarly, cowpea's productivity relies on rainfall (0.4471) and temperature (0.2724) for growth under rain-fed systems. Across all crops, consistent pairwise comparisons (CR ≤ 0.1) affirm the reliability of the findings, emphasizing targeted management strategies such as soil texture improvement, water conservation, and erosion control to enhance crop-specific soil suitability and productivity
The assessment of surface and underground water quality at ABU Farm indicates both sources are suitable for irrigation, with manageable risks. Neutral to slightly alkaline pH levels (7.15–7.32) support most crops, though prolonged use may affect nutrient availability. Low Electrical Conductivity (ECe) and Total Dissolved Solids (TDS) ensure minimal salinity risks, fostering sustainable irrigation. However, the higher Sodium Adsorption Ratio (SAR) of underground water (11.194) suggests potential sodicity risks, necessitating measures to maintain soil permeability and root access. While levels of carbonate, bicarbonate, chloride, boron, and sulphate are within safe limits, the low concentrations of essential micronutrients (Fe, Mn, Cu, Zn) highlight the need for fertilization to support crop health and soil fertility. Strategic management of these parameters is essential for long-term agricultural productivity and soil sustainability.
Prof, Nafiu Abdu
Deputy Director
Institute for
Agricultural Research, Samaru
Ahmadu Bello University, Zaria
Soil surveys play a critical role in understanding soils' characteristics, capabilities, and limitations in a given area. They provide essential information for land management, agricultural productivity, environmental sustainability, and infrastructural development. The soil survey conducted at Ahmadu Bello University (ABU) Research Farm aims to generate detailed information on the spatial distribution of physical and chemical properties, and classification of the soils present within the farm. This data will be a fundamental tool for researchers, agriculturalists, and land managers in making informed decisions about the most appropriate use of land resources.
The ABU Research Farm, located in Zaria, Northern Nigeria, lies within the Northern Guinea Savanna agroecological zone, characterized by tropical climatic conditions. The farm is a critical resource for practical agricultural research, and understanding soil variability is paramount for optimizing crop yields, managing irrigation practices, and ensuring sustainable land use.
The aim of the survey was to assess the suitability of the soils for various agricultural purposes and recommend best management practices to improve soil health and productivity.The objectives of this soil survey are mapping the soil types present in the farm, analysing key soil properties, nutrient availability, and classifying the soils according to the USDA Soil Taxonomy.
This report explained in detail the methodology used in the soil survey, including site selection, sampling, and analysis techniques, followed by the presentation of findings and their implications for agricultural practices at the ABU Research Farm
The survey took place at the Ahmadu Bello University farm in Shika, situated within the Giwa and Sabon Gari Local Government Area of Kaduna State. Covering around 401 hectares, the farm lies between latitudes N 12°37'00" to N 12°39'40" and longitudes E 3°46'00" to E 3°48'00" (Figure 1). The farm plays a vital role in supporting the university’s agricultural programs by offering hands-on training in crop cultivation and livestock management. Its mission is to boost agricultural productivity and innovation through research and development, while also showcasing modern farming techniques and promoting sustainable practices.
The geology of Zaria is part of the Northern Nigerian Basement Complex, which is dominated by Precambrian rocks. The main geological features of Zaria include Basement Complex Rocks, these are primarily composed of ancient crystalline rocks such as granites, gneisses, and migmatites. These rocks are part of the Precambrian basement, which is the foundational crust of this region. The granites occur has a large mass of granitic rock well known for its Zaria Batholith. Granites in this region are mostly intrusive igneous rocks that have slowly crystallized from molten magma deep beneath the Earth's surface. Gneisses and Schists are the most abundant metamorphic rocks in the area, indicating a history of high pressure and temperature conditions that transformed the original rocks. Pegmatites and Quartz Veins which occur as minor intrusions in the granite, often hosting valuable minerals like feldspar and mica.
Geomorphologically, Zaria's landscape is shaped by both fluvial and structural processes, with several notable features such as Zaria Granite Domes and Inselbergs, these are rounded hills known as inselbergs, which are typically composed of resistant granitic rocks.

Figure 1: Map of Kaduna State showing the Survey Area between Giwa and Sabon Gari Local Government Area
The climate of the surveyed area is classified as a tropical savanna climate (Aw) according to the Köppen climate classification. The region's climate is heavily influenced by the seasonal migration of the Intertropical Convergence Zone (ITCZ), which brings about changes in wind patterns and rainfall. Zaria experiences a tropical savanna climate, characterized by distinct wet and dry seasons:
· Dry Season (November to April): The dry months generally feature higher temperatures and increased sunshine hours, particularly in November and December, which consistently record the highest sunshine levels. Rainfall is considerably lower during these months, The harmattan, a dry and dusty trade wind from the Sahara, often affects the region from December to February, reducing visibility and impacting air quality.
The rainy season in Zaria typically begins in June and lasts through September. However, over the decades, increasing variability in rainfall patterns has become evident, especially in recent years where a reduction in rainfall has been observed during peak months. Annual rainfall in Zaria ranges between 1,000 mm and 2,200 mm (Figure 2), following a monomodal distribution pattern, with the highest rainfall usually occurring in August. The rainfall pattern in Zaria has undergone significant changes over the decades, reflecting broader climatic shifts. The rainfall trends from 1984-1993 (Figure 2.2) exhibits moderate rainfall levels, with peaks occurring in July and August. The overall pattern shows a clear wet season with substantial precipitation. The trend from 1994-2003 shows a noticeable increase in rainfall especially in August, where levels exceed those of the previous decade. This indicates a more intense rainy season. From 2004-2013, rainfall remains high but shows a slight decline compared to the previous decade. The wet months still receive significant precipitation, though September may experience reduced rainfall. This recent decade (2014-2023) exhibits a significant drop in rainfall during the wet months, especially in July, August, and September. This decline indicates potential changes in moisture availability or shifts in weather patterns affecting precipitation. The transition to drier conditions appears quicker in recent years, particularly evident by October.
 Figure 2:
Rainfall trends in Zaria
Figure 2:
Rainfall trends in Zaria
Zaria experiences a tropical wet and dry climate characterized by distinct seasonal temperature variations. The temperature varies from 20°C to 38°C (Figure 3) The highest temperatures are experienced in April like other places in Northern Nigeria. Low temperatures are usually observed in December and January which correspond to the peak period of the harmattan. In Northern Nigeria, the night temperatures are referred to as the ‘winter’ of the tropics as the temperatures are usually the coolest but as the sun rises, it heats up the atmosphere and the land surfaces thereby increasing the diurnal temperatures. The temperature trend in Zaria over the past four decades reveals notable seasonal patterns and variations that may reflect broader climatic changes. The decadal temperature trend from 1984-1993 shows relatively stable temperature ranges, with average highs around 30-35°C during the dry season and cooler temperatures during the rainy months. A slight increase in average temperatures is observed from 1994-2003, particularly during the dry season. This decade indicated a warmer condition compared to the previous one. From 2004-2013, temperatures remain high but show fluctuations, with some months experiencing increased heat, particularly in March and April. The wet months also display slightly elevated temperatures compared to earlier decades. the recent decade (2014-2023) exhibits higher average temperatures across most months, especially during the dry season. Notably, July and August show less cooling than in previous decades, suggesting a potential warming trend. The dry season consistently experiences higher temperatures across all decades, with peaks typically occurring in March and April. The wet season shows a cooling effect due to increased cloud cover and rainfall; however, recent years indicate that this cooling is less pronounced than in earlier decades. An overall warming trend is evident in recent years, particularly during the dry months. The increase in average temperatures over the last two decades may suggest broader climatic shifts affecting Zaria. This aligns with global trends of rising temperatures due to climate change. Changes in rainfall intensity and timing could be influencing temperature patterns, particularly the reduced cooling effect during wet months.

Figure 2: Time series of average monthly temperature in Zaria
The relative humidity in the study area aligns closely with rainfall patterns. As the wet season progresses, relative humidity increases correspondingly. These variations in humidity also mirror temperature changes. The relative humidity is at its lowest in February, gradually rising until it peaks in August (Figure 4), after which it declines with the onset of the harmattan. The analysis of the relative humidity trend in Zaria over the past four decades (Figure 4) reveals significant seasonal patterns and notable changes that may reflect broader climatic shifts. The trend in relative humidity from 1984-1993 shows moderately high humidity values, particularly from June to August, with July and August reaching around 75-80%. A noticeable increase in relative humidity from 1994-2003 occurs during peak months, especially in August, where levels exceed 80%. indicating a more intense rainy season compared to previous years. From 2004-2013 the relative humidity remains high from June to September but shows a slight decline compared to the previous decade. There is also a visible drop in humidity from October onward. In recent years 2014-2023 a sharp decline in humidity levels, particularly during the wet months of July, August, and September. This decline suggests possible changes in moisture availability or weather patterns affecting cloud formation. July and August consistently exhibit the highest relative humidity levels across all decades, marking the peak of the rainy season. October shows a notable decline in humidity levels in recent decades, suggesting a quicker transition to drier conditions. Relative Humidity levels during the dry season remain relatively stable across decades, indicating that these months have not been as affected by recent climate variability.

Figure 3: mean monthly relative humidity in IAR Zaria
Sunshine hours fluctuate throughout the year, showing an inverse relationship with rainfall. As the wet season progresses, increased cloud cover leads to a reduction in daily sunshine hours. Cloudiness peaks in August, resulting in the lowest sunshine hours during this month. Conversely, the highest sunshine hours occur in March, during the dry season, reaching up to 11.47 hours. Figure 5 illustrates this pattern, with the lowest sunshine hours in August at the height of the rainy season and the highest in March during the dry months. The decadal change in sunshine hours from 1984-1993 shows relatively high sunshine hours across most months, particularly in February, October, and November. There is a dip in sunshine during the rainy season, notably in July and August, when the sunshine hours drop below 6. From 1994-2003 (Blue) sunshine hours show a slight reduction, particularly during August and September. Interestingly, sunshine hours in January and December remain relatively stable compared to the previous decade. The sunshine hours 2004 to 2013 are moderate, with slightly lower sunshine levels in some months, especially in July and August. This suggests increased cloud cover or longer rainy seasons during these months. In recent years (2014-2023), there has been a notable increase in sunshine hours during the dry season (November to March). However, the wet months, especially August, show lower sunshine compared to the previous decades Months like January, February, November, and December have remained relatively stable in terms of sunshine hours across decades, especially during the recent decade (2014-2023). These months consistently exhibit over 7 hours of sunshine daily. The lower sunshine hours during July and August align with the peak rainy season in Zaria when cloud cover is typically extensive. The recent decade shows a further reduction in sunshine, possibly due to longer or more intense rainy periods. The months of June, July, and August consistently show lower sunshine hours, with the 2014-2023 period experiencing a noticeable dip in July and August. This trend could reflect increased cloud cover and rainfall. The stable sunshine hours during the dry months (November to March) suggest that dry season conditions have not been significantly affected by climate variability, maintaining clear, sunny weather typical of the region.
A significant rebound in sunshine occurs in October and November, marking the transition from the rainy to dry season. In recent decades, November consistently shows around 8-9 hours of sunshine daily. The noticeable drop in sunshine during the wet season in the recent decade could indicate climatic shifts, with increased cloud cover or extended rainy periods affecting sunshine levels.

Figure 4: Sunshine hours trends in Zaria from 1984-2023
Zaria, situated in northern Nigeria, lies within the moist Guinea savanna zone, characterized by unique vegetation and land-use patterns shaped by climate, soil, and human activity. The region features a blend of natural vegetation and widespread agricultural land, making it a vital farming hub in Nigeria. The savanna is dominated by grasses, which can grow up to 2-3 meters during the rainy season. Notable grass species include Andropogon gayanus (Gamba grass), Hyparrhenia rufa (Thatching grass), and Panicum maximum (Guinea grass). The landscape is interspersed with drought-resistant trees adapted to the prolonged dry season, such as the Baobab (Adansonia digitata), Shea Butter Tree (Vitellaria paradoxa), Locust Bean Tree (Parkia biglobosa), various Acacia species, and the Neem Tree (Azadirachta indica). Typical of the Guinea savanna, shrubs are also prevalent. Additionally, gallery forests and denser tree clusters are found near rivers and low-lying areas, while small pockets of woodland in less disturbed zones support local wildlife and enhance biodiversity.
Farming is the predominant land use in and around Zaria. The region’s relatively fertile soils and seasonal rainfall support the cultivation of both food crops (Maize, millet, cowpea yams etc) and cash crops (cotton, soybean, and tobacco). Livestock rearing is common, with cattle, sheep, goats, and poultry being important in the region. Irrigation Farming is often practiced in the dry season, particularly along rivers and water bodies, farmers grow vegetables like tomatoes, peppers, onions, and leafy greens, as well as rice in some areas where irrigation facilities are available.
Zaria is home to Ahmadu Bello University (ABU) and has a rapidly growing urban population. The expansion of the city and its infrastructure has led to the conversion of agricultural and forested land into residential, commercial, and institutional land uses. Urban sprawl has also contributed to increased pressure on natural resources, particularly through deforestation and land degradation
To carry out the soil survey to meet the desired goal, the following methods were adopted.
Previous soil, topographical, vegetation and land use, geological, land suitability maps and reports covering the project area, and climate data were collected.The maps, reports and information collected were reviewed and analysed regarding their adequacy for land suitability evaluation.
Pre soil survey site visit was conducted on the 1st of March 2024 to get acquainted with the survey area for planning, logistics, reconnaissance, and actual fieldwork for the survey. The visit helped the experts in getting acquainted with the terrain, access routes, and the extreme boundaries of the project area.
The project site was divided with grids at 300 m intervals across the area (Map 3.1). The base map was produced at a scale of 1:13,500 for the purpose of field work only, while 1:15,000 was used for final maps production. The base maps with the grids were uploaded to a Geographical Positioning System (GPS), Tablets/ Androids Phones for detailed field work.
3.4 Detailed Fieldwork
3.4.1 Field mapping
The detailed fieldwork was carried out using the waypoints in the GPS/tablets and a hard copy of the base map and auger boring at the grids to identify soils occurring in the project area. Auger boring was made to the depth of 130 cm or an impenetrable layer. Soil descriptions were made at 25 cm depth intervals where possible. The environmental characteristics and selected soil morphological characteristics were recorded. These include locating local relief in terms of slope position and slope class, risk of soil erosion and deposition, rock outcrop, surface characteristics, vegetation, and land use. The some of the morphological characteristics evaluated were soil depth, colour of matrix and mottles (if any), texture, stoniness, consistency, nature and abundance of included materials, roots, and drainage conditions.
 Map 3.1:
Basemap with grids and auger observation/sampling points of ABU Farm
Map 3.1:
Basemap with grids and auger observation/sampling points of ABU Farm
The auger descriptions
were classified and plotted along the traverses of the base map. Soil boundary
lines were drawn to fix soil mapping unit polygons. The soil mapping units
identified in the survey areas are shown on the soil map provided at a scale of
1:10,000 and 1:20,000. The properties employed in the process of delineating
soil mapping units were mainly the morphological and physical soil
characteristics mentioned above, these differentiating parameters are
considered significant in the use of the soils, since they collectively
influence the water and nutrient holding capacities and permeability of the
soil![]() to
plant roots and drainage. A total of Five soil mapping units were identified in
the survey area denoted ABU1, ABU2, ABU3, ABU4, and ABU5. In all the soil
mapping units one soil profile pit was dug, described, and sampled according to
their genetic horizons. Each soil profile pit was dug to standard size to a
maximum depth of 200 cm, 200 cm long, and 150cm wide unless an impenetrable
layer or water table was encountered.
to
plant roots and drainage. A total of Five soil mapping units were identified in
the survey area denoted ABU1, ABU2, ABU3, ABU4, and ABU5. In all the soil
mapping units one soil profile pit was dug, described, and sampled according to
their genetic horizons. Each soil profile pit was dug to standard size to a
maximum depth of 200 cm, 200 cm long, and 150cm wide unless an impenetrable
layer or water table was encountered.
3.4.2 Soil profile pit description
The Five soil profile pits were described based on the morphological characteristics followed the pattern of USDA (Soil Survey Staff, 2014) and FAO (2014). Morphological characteristics such as soil depth, horizon, thickness, colour of matrix and mottles (if any), texture, structure, consistency, porosity including materials, roots, and horizon boundary. The site characteristics such as vegetation, land use, landform, degree and aspect of slope erosion and deposition, drainage, and surface characteristics were recorded
3.4.3 Soil sampling
Following the description of the soil profile pits, soil samples were collected for laboratory characterization. Three types of soil samples were collected as follows:
a. Disturbed soil samples from soil profile pits
Bulk soil samples were collected from genetic horizons and stored in a labelled plastic bags. A total of 21 bulk soil samples were collected from 5 soil profile pits in the survey areas for soil characterization.
b. Undisturbed core samples
Undisturbed core samples were also taken from the soil profile pits for bulk density, total porosity, saturated hydraulic conductivity, and moisture retention determinations. The core samples were taken at each genetic horizon with the aid of a labelled core sampler .
c. Soil sampling for interpolation, fertility, and suitability evaluation
Disturbed surface soil samples were collected with sampling points spread over the survey area The bulk samples were taken at the auger observation points at 300m grid intervals. The auger observation coordinates were captured with the help of a hand-held GPS (Garmin GPS map 76 model). A total of 52 soil samples were collected, by using an Edelman auger at the depth of 0–30 cm, for surface soil characterization, interpolation, fertility evaluation, and crop suitability evaluation purposes using Multicriteria Decision Methods (MCDM) and Analytic Hierarchy Process (AHP)
The quality of surface and groundwater significantly influences soil properties, plant growth, and overall crop performance, ultimately determine the success and sustainability of any irrigation project. Two water samples were collected, one from the surface (Dam) and one from the subsurface (Tub well).
3.6 Infiltration Measurement
Infiltration measurements were made at each pedon using Turf-Tech double-ring infiltrometer. The infiltrometer was installed to a depth of about 10 cm, water was poured first into the outer cylinder and then into the inner cylinder. The water level in the inner cylinder was read with the gauge build info on the infiltrometer. Readings were taken until an equilibrium infiltration had been reached.
3.7 Laboratory Studies
The disturbed soil samples collected from soil profile pits and the soil sampled from the auger observation for fertility suitability evaluation were air-dried, crush , and sieved to remove materials larger than 2mm. The less than 2mm fractions was used for laboratory studies. Materials > 2mm were recorded as gravel while the core samples were used to determine the hydraulic conductivity and bulk density of the soil
a) Soil physical analysis
Ø Bulk density
Bulk density was determined by oven-drying the core soil samples were at 105°C for 24 hours, and dividing the dried weight of the soil by the volume of the core sampler (Blake and Hartage, 1986),
Ø Total porosity
The total porosity was calculated mathematically from the bulk density values using the formula:
![]()
Where TP = Total porosity
Db = Bulk density
Soil particle density was detertmined at the range of (2.256- 2.622 gcm3)
Ø Saturated hydraulic conductivity
Ø The constant head permeameter method was used to determine saturated hydraulic conductivity by measuring water flow through a soil sample under a steady head, quantifying soil permeability to water under saturation as described of Klute and Dirksen. (1986).
Ø Moisture retention characteristic: Moisture retention was assessed at various suction pressures (0, -5, -10, -33, -100, and -1500 kPa) using a suction bar, employing the low-pressure plate and pressure membrane extractor method as described by Klute and Dirksen (1986).Available Water (AW) in soil was calculated using the formula:
![]()
Where:
Ø Moisture content of surface soils at infiltration site. The samples weight, over dried for 24 hours and weight again. The in weight was taken for the weight of moisture content.
Ø Particles size distribution and texture: was determined by the hydrometer method and textural class using the USDA textural triangle, Gee and Bauder (1986)
b) Soil chemical analysis
Ø Soil Reaction (pH): was determined potentiometrically after equilibrium with water and CaCl2 in soil solution ratio of 1:2.5 using a glass electrode pH meter.
Ø Electrical conductivity (ECe)
The ECe was determined on a 1:1 soil water saturation extract obtained by soaking the soil overnight, using a conductivity meter.
Ø Organic carbon: Organic carbon (OC) in soil is determined using the Walkley-Black method, which involves oxidizing soil organic matter with potassium dichromate, followed by titration to calculate the organic carbon content (Nelson and Sommers 1982).
Ø Total nitrogen:The Kjeldahl method was used to determines total nitrogen (TN) in soil by digesting the sample with sulphuric acid and a catalyst, followed by distillation and titration of the released ammonium to quantify nitrogen content (Bremner and Mulvaney 1982).
Ø Exchangeable cations (Ca, Mg, K, Na): Exchangeable cations were extracted using 1N ammonium acetate (NH₄OAc) solution at pH 7. Calcium Ca and Mg were analysed using an atomic absorption spectrophotometer (AAS), while Potassium K and Sodium Na were determined using a flame photometer (IITA, 1979).
Ø Exchangeable acidity (Al3+ + H+): Exchangeable acidity is determined by leaching soil with 1N potassium chloride (KCl) solution, followed by titration to measure the concentrations of exchangeable hydrogen (H⁺) and aluminium (Al³⁺) ions. (McLean, 1965).
Ø Cation exchange capacity (CEC): Cation exchange capacity (CEC) is determined by saturating soil with a neutral 1N ammonium acetate (NH₄OAc) solution, displacing the adsorbed cations, and quantifying them using titrimetric methods.--- (Rhodes, 1982).
Ø Base saturation (BS): Base saturation was calculated from the formula:
%
base saturation = ![]()
Ø Exchangeable sodium percentage (ESP): ESP is calculated from the formula:
ESP
= ![]()
Ø Sodium adsorption ratio (SAR): SAR is obtained from the formula:
SAR
= 
Ø Carbonate and bicarbonate: Carbonate and bicarbonate in the soil was determined by method designed by Coltenie. This involves extracting soil with a dilute hydrochloric acid (HCl) solution. The released carbon dioxide (CO₂) is measured, and the concentrations of carbonate and bicarbonate are calculated based on the volume of CO₂ evolved during the reaction. FAO (1980). Available phosphorus (AP)
Ø Available phosphorus in soil was determined by extracting the phosphorus using a suitable solution, commonly Bray-1. The extract was then analysed, using a colorimetric method, to quantify the amount of phosphorus available in the soil. (Bray and Kurtz, 1945).
Ø Soluble Chloride was determined using the silver nitrate (AgNO₃) method, which involves extracting the chloride ions from the soil using water. The extracted solution is then titrated with a standard silver nitrate solution, and the chloride concentration was calculated based on the volume of silver nitrate required to precipitate all chloride ions as silver chloride (AgCl).
Ø Available Micronutrients (Zn, Fe, Mn, Cu by HCl acid extraction (Norveet, 1978) and AAS)
3.8 Water Analyses
The water samples collected were analysed for the following parameters:
- Total dissolved salts were determined by evaporating a known volume of water to dryness and weighing the remaining residue
- pH using a pH meter
- Electrical conductivity (EC) using conductivity meter
- Dissolved cations (Ca, Mg, K, Na) dissolved K and Na by the use of flame photometer while Ca and Mg by atomic adsorption spectrophotometer (AAS).
- Carbonate and bicarbonate by the rapid titration method.
- Boron is obtained by using Azomethine H and reading the concentration using Spectronic 20.
- Sulphate by the turbidimetric method
- Chloride by using silver nitrate and potassium dichromate
- Nitrate by distillation and titration method of Bremer (1965).
- Heavy metals: Zinc (Zn), Copper (Cu), Iron (Fe), and Manganese (Mn) by atomic adsorption spectrophotometer (AAS).
3.9 Fertility and Suitability Evaluation
Ø Spatial distribution/Interpolation
Relevant data sets (climatic, topographic, and soil) were prepared in the form of thematic maps using ArcGIS 10.8 and Spline with barrier geostatistical techniques to develop continuous surfaces derived from the data to determine the amount and spatial distribution of morphological, physical, and chemical parameters in a GIS environment.
Ø Suitability evaluation
The analytic Hierarchy Process (AHP) constructs a pair-wise comparison matrix by assigning values in the range of 1–9 for each factor against every other (Saaty, 1980) which finally gives in eigenvector weights indicating the relative importance of the various factors considered. Based on similar climatic conditions, the opinions of selected crop specialists, and the availability of selected crop requirement data from previous studies, evaluation criteria were developed. Identifying the best land-use class for the study area entails combining information from different parameters that influence selected crop production. In thethis study, three main criteria (Topography, climate, and soil) and 7 to 12 sub-criteria were chosen for analysis (rainfall, Tmin, Tmax, slope, drainage, soil texture, OC, stoniness, BSP, ESP, ECe, and pH,) were undertaken for land suitability of maize, sorghum, soybean, and cowpea. The consistency of decisions in scoring the criterion determines the accuracy of the measured weights in the pairwise comparison matrix. The data on the suitability of maize, sorghum, soybean, and cowpea crop cultivation were rated into highly suitable (S1), moderately suitable (S2), marginally suitable (S3), and not or unsuitable (N) classes. Thus, all these criteria maps were prepared using GIS tool and AHP method by considering the above mentioned crop requirement (suitability of maize. sorghum, soybean and cowpea crop). The weighted overlay tool was used in ArcGIS to prepare a suitability map for each crop using the equation below.
SI=∑Wi∗XiSI=∑Wi∗Xi,
Where: SI = Suitability Index,
Wi = weight of factor i,
and Xi = normalized criterion score.
4.1 General Soil Pattern Based on Mapping Units
In this report, a soil mapping unit is defined as a group of soils with similar profile characteristics, including horizon arrangement. This concept encompasses soils with comparable morphological, topographical, and physical attributes such as depth, drainage, soil matrix colour (including mottles), texture, and structure. Although soil mapping units exhibit some degree of variation, particularly in depth, texture, and horizon arrangement; they are categorized based on these shared characteristics. The soils in the surveyed area (ABU Farm), primarily originate from basement complex parent materials, exhibit considerable complexity.
Table 4.1 Extent of the soil mapping units in the survey area
|
Soil Mapping Unit Symbol |
Area (ha.) |
Proportion of Area (%) |
|
ABU 1 |
229.96 |
56.87 |
|
ABU 2 |
60.85 |
15.05 |
|
ABU 3 |
34.03 |
8.42 |
|
ABU 4 |
13.62 |
3.37 |
|
ABU 5 |
39.12 |
9.67 |
|
DAM |
26.77 |
6.62 |
|
404.35 |
100 |

Map 4.1: Soil Map of ABU Farm Shika Zaria
ABU1 soil mapping unit, situated on a mid-slope with a gentle slope gradient (0-2 %), is characterized by its very deep profile (Fig. 4.1), extending to a depth of 166 cm. This unit is well-drained soil and well developed, exhibiting distinct morphological properties.

Figure 4.1: Depth characteristics of the soil mapping units
The boundaries (Appendix A) between the soil horizons in ABU1 are clear and smooth, which signifies a gradual and predictable transition between layers. Such boundaries suggest consistent soil development processes with minimal disturbance. This stability ensures that the transition from topsoil to subsoil does not create sudden changes in root zone conditions, which is beneficial for crops that require uniform rooting environments.
The ABU1 soil unit is classified as well-drained, a key attribute for agricultural productivity. The well-drained conditions prevent waterlogging and the associated risks of anaerobic conditions, which could otherwise hinder plant growth. These drainage properties are particularly advantageous for crops sensitive to waterlogged conditions, such as maize, which thrives in aerated soils. Well-drained soils also help in preventing the accumulation of salts, thus maintaining the low electrical conductivity (ECe) values seen across all horizons.
The subsoil (150-166 cm) is described as gravelly, indicating an accumulation of coarse fragments in the deeper profile. While this stoniness does not pose significant issues at the surface or upper subsoil layers, it may restrict root penetration at depths beyond 150 cm. For crops with shallow to medium rooting systems, this stoniness is unlikely to affect productivity. However, for deep-rooting crops like cassava or certain tree crops, the gravelly nature of the Btv horizon could limit water and nutrient uptake, requiring more strategic management practices to ensure adequate nutrition and water supply.
The topsoil (0-35 cm) displays a moderate medium subangular blocky structure, which is ideal for root growth and water infiltration. Moving deeper into the profile, the structure becomes finer and stronger in the Bt1 (35-80 cm) and Btv (110-166 cm) horizons, shifting to a subangular blocky structure. The presence of such structures is a positive indicator for soil stability and root penetration, contributing to plant productivity. However, the BCv horizon (150-166 cm) is described as massive with a gravelly clay texture, indicating a more compacted, less permeable layer. This could restrict water movement and root growth in the deeper layers, suggesting potential limitations for deep-rooted plants. The evolution of the soil structure from moderate blocky forms in the upper horizons to more compact, massive structures in the lower horizons suggests active soil formation processes, particularly clay illuviation. The increasing clay content and the presence of subangular blocky structures in the subsoils indicate that this soil unit is well-suited for crops that benefit from good water retention in the upper layers but may require specific management practices in deeper, compacted horizons.
The soil texture transitions from sandy loam in the topsoil to clay loam and eventually to a gravelly clay texture in the Btv horizon (Fig. 4.2). The increasing clay content (46 % in Btv2) with depth contributes to better water retention and nutrient-holding capacity. However, excessive clay in the subsoil may hinder water drainage and root penetration, posing a challenge for crops requiring deep rooting systems. This increase in clay content correlates with the observed increase in cation exchange capacity (CEC), given that clay particles have a larger surface area for nutrient retention. The sandy loam topsoil favours agricultural activities due to its balance between water retention and drainage, while the clay-rich subsoils provide a robust nutrient reservoir, albeit with reduced permeability.

Figure 4.2: Depth function of soil textural classes of the soil mapping units
The topsoil has a dark yellowish-brown colour (10YR 4/6), which evolves into strong brown (7.5YR 4/6) and yellow-red (5YR 5/8) in the subsoils (Fig. 4.3). These colour changes are indicative of oxidation processes and variations in mineral composition, particularly the presence of iron oxides. The darker hues in the topsoil suggest higher organic matter content, which decreases with depth, while the redder tones in the lower horizons point to stronger oxidation and weathering processes.

Figure 4.3: Depth function of soil colour matrices of the soil mapping units
Bulk density (BD) values ranged from 1.34 Mg m-3 to 1.89 Mg m-3, showing variability between topsoil and subsoil layers (Fig. 4.4). The topsoil BD of less than 1.54 Mg m-3 suggests moderate compaction, promoting water infiltration and root penetration. However, higher subsoil BD values, particularly 1.89 Mg m-3, indicate compaction, which could reduce root growth and water infiltration, thereby lowering fertility. A correlation analysis between BD and total porosity (TP) shows a strong negative correlation (r = -1.000***, Fig. 4.5), indicating that higher BD reduces porosity, limiting water and air movement in the soil. Additionally, BD negatively correlates with soil available moisture (SAM) (r = -0.637), suggesting that compacted soils retain less moisture, which is vital for plant growth.

Figure 4.4: Distribution of soil physical properties

Figure 4.5: Scatter plot matrix for soil physical properties vs OC and CEC
Particle density (PD) was fairly consistent across the soil profile, with values ranging from 2.357 to 2.39 Mg m-3. The relatively stable PD reflects uniform mineral composition in the soil, with minimal impact on organic matter content or fertility. However, particle density correlates negatively with organic carbon (OC) (r = -0.129, Fig. 4.5), indicating that higher PD values might be linked to lower organic matter content. This could imply less aggregation and poorer soil structure, which indirectly impacts fertility by reducing moisture retention and nutrient availability. While PD doesn’t strongly affect other fertility indicators, it has a weak positive correlation with cation exchange capacity (CEC) (r = 0.291), suggesting that lower mineral density could marginally reduce nutrient-holding capacity.
Hydraulic conductivity (K-sat) showed significant variation, ranging from 0.83 cm/hr to 2.36 cm/hr. The topsoil K-sat of 1.82 cm/hr (Fig. 4.5) suggests good permeability, allowing for adequate drainage. Subsoil layers with lower K-sat values (e.g., 0.83 cm/hr) reflect reduced permeability due to clay accumulation (illuviation), a key pedogenic process. Poor drainage in these layers can lead to waterlogging, affecting root respiration and nutrient uptake. There was a negative correlation between K-sat and total exchangeable bases (TEB) (r = -0.68), indicating that soils with higher permeability tend to lose more nutrients through leaching. This is further supported by the negative correlation between K-sat and organic carbon (r = -0.119), where soils with rapid water movement often have reduced organic matter content due to leaching and decomposition. In contrast, soils with higher hydraulic conductivity have a positive correlation with exchangeable sodium percentage (ESP) (r = 0.49), implying potential for sodium accumulation in highly permeable soils, which could lead to sodicity problems and reduced fertility.
Soil available moisture (SAM) values also varied significantly within the profile, with the topsoil having 3.45 % and subsoils ranging from 1.6 % to 8 % (Fig. 4.5). SAM is crucial for maintaining moisture between rainfall events and supporting plant growth. There was a positive correlation between SAM and organic carbon (OC) (r = 0.478), indicating that higher organic matter content enhances the soil’s ability to retain moisture. SAM correlated negatively with CEC (r = -0.116), showing that soils with greater moisture-holding capacity tend to have a lower nutrient retention capacity, directly affecting fertility. Additionally, SAM positively correlated with total nitrogen (TN) (r = 0.81), as higher water retention supports microbial activity, nitrogen mineralization, and overall nutrient cycling.
|
Table 4.2 Physical properties of soil mapping units of ABU Farm, Shika, Zaria survey area |
|||||||||||||||||||||
|
Horizon |
Depth |
Clay |
Silt |
Sand |
Text class |
Bulk density |
Part. density |
TP |
k |
MR 0 bar |
MR 0.1 bar |
MR 0.33 bar |
MR 5 bar |
MR 10 bar |
MR 15 bar |
Avail Moist |
Avail Moist |
|
|||
|
* |
cm |
g/kg |
|
Mg/m3 |
Mg/m3 |
% |
cm/hr |
% |
cm |
120 cm |
|
||||||||||
|
Pedon ABU1 |
SOIL MAPPING UNIT ABU 1 |
||||||||||||||||||||
|
Ap |
0-35 |
100 |
600 |
300 |
SiL |
1.54 |
2.366 |
34.91 |
1.82 |
0.267 |
0.253 |
0.146 |
0.128 |
0.108 |
0.082 |
3.45 |
|
|
|||
|
Bt |
35-80 |
280 |
580 |
140 |
SiCL |
1.34 |
2.39 |
43.93 |
0.98 |
0.335 |
0.254 |
0.236 |
0.203 |
0.15 |
0.117 |
7.18 |
|
|
|||
|
Btv1 |
80-130 |
360 |
520 |
120 |
SiCL |
1.51 |
2.366 |
36.18 |
0.83 |
0.296 |
0.253 |
0.229 |
0.192 |
0.142 |
0.123 |
8.00 |
18.63 |
|
|||
|
Btv2 |
130-150 |
460 |
480 |
60 |
SiCL |
1.39 |
2.39 |
41.84 |
0.83 |
0.287 |
0.251 |
0.215 |
0.194 |
0.123 |
0.09 |
3.48 |
|
|
|||
|
BCv |
150-166 |
360 |
460 |
180 |
SiCL |
1.89 |
2.357 |
19.81 |
2.36 |
0.201 |
0.197 |
0.18 |
0.158 |
0.142 |
0.127 |
1.60 |
|
|
|||
|
Pedon ABU2 |
SOIL MAPPING UNIT ABU2 |
||||||||||||||||||||
|
Ap |
0-30 |
140 |
460 |
400 |
L |
1.706 |
2.622 |
34.94 |
0.524 |
0.25 |
0.219 |
0.155 |
0.13 |
0.108 |
0.086 |
3.53 |
|
|
|||
|
Bat |
30-55 |
380 |
280 |
340 |
CL |
1.506 |
2.302 |
34.58 |
0.65 |
0.322 |
0.296 |
0.199 |
0.149 |
0.116 |
0.098 |
3.80 |
|
|
|||
|
Bt |
55-90 |
380 |
300 |
320 |
CL |
1.834 |
2.302 |
20.33 |
0.509 |
0.263 |
0.231 |
0.192 |
0.154 |
0.132 |
0.116 |
4.88 |
|
|
|||
|
Btv |
90-132 |
400 |
320 |
280 |
CL |
1.78 |
2.526 |
29.53 |
0.909 |
0.271 |
0.217 |
0.177 |
0.151 |
0.135 |
0.124 |
3.96 |
16.17 |
|
|||
|
BCv |
132-165 |
440 |
360 |
200 |
C |
1.291 |
2.256 |
42.77 |
0.982 |
0.331 |
0.275 |
0.127 |
0.089 |
0.065 |
0.059 |
2.90 |
|
|
|||
|
Pedon ABU3 |
SOIL MAPPING UNIT ABU3 |
||||||||||||||||||||
|
Apg |
0-28 |
360 |
460 |
180 |
SiCL |
1.208 |
2.31 |
47.71 |
1.497 |
0.354 |
0.308 |
0.275 |
0.239 |
0.212 |
0.178 |
3.28 |
|
|
|||
|
ACg |
28-60 |
300 |
460 |
240 |
CL |
1.321 |
2.39 |
44.73 |
2.481 |
0.361 |
0.298 |
0.241 |
0.186 |
0.154 |
0.132 |
4.61 |
|
|
|||
|
2ACg |
60-97 |
340 |
500 |
160 |
SiCL |
1.364 |
2.279 |
40.15 |
2.245 |
0.384 |
0.275 |
0.207 |
0.175 |
0.143 |
0.118 |
4.49 |
|
|
|||
|
2Cg |
97-130 |
300 |
500 |
200 |
CL |
1.742 |
2.39 |
27.11 |
1.309 |
0.249 |
0.206 |
0.162 |
0.134 |
0.108 |
0.088 |
4.25 |
16.63 |
|
|||
|
3Cg |
130-180 |
480 |
320 |
200 |
C |
1.979 |
2.286 |
13.43 |
0.982 |
0.181 |
0.146 |
0.146 |
0.131 |
0.106 |
0.079 |
6.63 |
|
|
|||
|
Pedon ABU4 |
SOIL MAPPING UNIT ABU 4 |
||||||||||||||||||||
|
Apg |
0-14 |
120 |
560 |
320 |
SiL |
1.448 |
2.425 |
40.29 |
1.492 |
0.257 |
0.253 |
0.237 |
0.211 |
0.181 |
0.154 |
1.68 |
|
|
|||
|
ABg |
14-30 |
140 |
520 |
340 |
SiL |
1.615 |
2.553 |
36.74 |
2.01 |
0.566 |
0.539 |
0.414 |
0.373 |
0.344 |
0.29 |
3.20 |
|
|
|||
|
Btgv1 |
30-60 |
280 |
500 |
220 |
CL |
1.434 |
2.357 |
39.16 |
2.357 |
0.25 |
0.229 |
0.205 |
0.18 |
0.145 |
0.093 |
4.82 |
|
|
|||
|
Btgv2 |
60-85 |
260 |
500 |
240 |
SiL |
1.719 |
2.526 |
31.95 |
0.786 |
0.207 |
0.203 |
0.194 |
0.172 |
0.146 |
0.129 |
2.79 |
12.5 |
|
|||
|
Pedon ABU5 |
SOIL MAPPING UNIT ABU 5 |
||||||||||||||||||||
|
Apv |
0-12 |
80 |
360 |
560 |
SL |
1.98 |
2.512 |
21.18 |
0.982 |
0.144 |
0.14 |
0.132 |
0.123 |
0.092 |
0.072 |
1.43 |
1.43 |
|
|||
|
Cv |
12-23 |
80 |
500 |
420 |
SiL |
Not Sampled |
|
|
|||||||||||||
|
Key: SiL= Silty loam, SiCL=Silty clay loam, CL= Clay loam, L=Loam, C=Clay, SL= Sandy loam, MR= Moisture retention, k= Sat. hydr. cond., TP= Total Porosity |
|||||||||||||||||||||
The chemical properties of the ABU1 soil unit further highlight its fertility potential, particularly in the topsoil. However, variations in nutrient availability and pH across the profile suggest targeted management practices for optimal agricultural use.
The organic carbon content was generally low. Though was highest in the topsoil (5.287 g kg-1, Fig. 4.6) and decreased significantly with depth, reaching 4.018 g kg-1 in the Btv1 horizon. This decline in organic matter is typical of soil profiles and reflects the reduced biological activity and decomposition of organic material in the subsoils. The strong negative correlation between depth and OC (r = -0.92) indicates that the surface layers are more fertile, while the subsoils are more nutrient-limited. This has important implications for nutrient management, particularly for crops that rely on the fertility of both topsoil and subsoil.

Figure 4.6: Depth function of OC, TN and AP by horizon
Similarly, total nitrogen content was generally low, peaked at 0.504 g kg-1 in the topsoil and decreased to 0.224 g kg-1 in the Btv2 horizon, following the trend of organic carbon (Fig. 4.6). The correlation between TN and depth (r = -0.89) suggests that nitrogen management will be crucial for maintaining soil fertility, particularly in deeper layers where nutrient availability is lower.
Available phosphorus was relatively low across the profile, with 11.76 mg kg-1 in the topsoil and 4.864 mg kg-1 in the Btv horizon. The correlation between depth and AP (r = -0.86) indicates that phosphorus availability decreased sharply with depth, which could limit plant growth, especially in deeper rooting systems. This low phosphorus content in the subsoil suggests the need for phosphorus supplementation to maintain crop yields.
The pH in water (pHw) ranged from 5.43 in the topsoil to 6.22 in the lower horizon, indicating slightly acidic to near-neutral conditions. The pH in CaCl2 (pHc) was consistently lower than pHw (Table 4.3, Fig. 4.7), ranging from 4.79 to 5.2, reflecting more acidic conditions when measured with CaCl2. The moderate acidity of the soil is suitable for most crops, though liming may be required for certain sensitive crops to optimize growth conditions.

Figure 4.7: pH changes with depth across horizons
The electrical conductivity of the soil was low across all horizons, with the highest value of 0.055 dS/m in the topsoil, decreasing to 0.013 dS/m in the subsoil. These values indicate that the soil is non-saline, which is favourable for a wide range of agricultural uses without the risk of salinity-related crop stress.
The exchangeable cations (calcium, magnesium, potassium, and sodium) display varying trends across the profile (Fig. 4.8). Calcium was highest in the sub-horizon (8 cmol/kg), while potassium levels were consistently low across all horizons (0.2 cmol/kg in Bt1). Sodium content peaked in the topsoil (0.26 cmol/kg) but decreased with depth, suggesting that the soil is not sodic, which is beneficial for maintaining soil structure and preventing dispersion.

Figure 4.8: Exchangeable bases levels
The CEC of the ABU1 soil was moderate to high, ranging from 10.29 cmol/kg in the topsoil to 11.56 cmol/kg in the Btv2 horizon. The positive correlation between CEC and clay content (r = 0.88) reflects the higher nutrient retention capacity in clay-rich soils, particularly in the deeper horizons. This indicates that the soil has a good ability to retain essential nutrients, although the low organic matter content in the subsoil may limit nutrient availability.
Effective Cation Exchange Capacity (ECEC) provides an overall picture of the soil’s ability to retain and supply essential cations to plants.
The percent base saturation (PBS) was high across all horizons, ranging from 89.8% to 92.2%, indicating that the soil is well-saturated with base cations. This high PBS reduces the risk of soil acidity and aluminium toxicity, making the soil suitable for most crops. The high base saturation reflects the dominance of exchangeable base cations (Ca, Mg, K, Na), which neutralize soil acidity and improve nutrient availability.
The Sodium Adsorption Ratio (SAR) is a critical parameter in evaluating the potential for soil sodicity which affects soil structure and permeability. In the ABU1 soil unit, SAR values were extremely low, with a maximum value of 0.12 in the topsoil (Fig. 4.9, Table 4.3), declining with depth. These low SAR values indicate that the soil is not sodic and poses no risk of sodium-induced structural degradation. This is an important feature, as non-sodic soils maintain better aggregate stability and permeability, facilitating root growth and nutrient availability.
The presence of low exchangeable acidity (EA) values, peaking at only 0.8 cmol/kg (Table 4.3) in the subsoil horizon (130 - 150 cm), further complements the high base saturation levels. This balance indicates that the soil is well-buffered against sudden pH changes, making it resilient under various agricultural practices that may involve chemical inputs like fertilizers. Exchangeable acidity refers to the amount of exchangeable hydrogen (H⁺) and aluminium (Al³⁺) in the soil. These cations contribute to soil acidity, and high levels are typically found in acidic soils. For the ABU1 soil unit, exchangeable acidity levels would provide insight into the need for lime application to raise pH and mitigate aluminium toxicity, improving plant root development.
Bicarbonate (HCO3) and chloride (Cl-) concentrations were very low throughout the profile. The HCO3- content peaked at 1.4 mg/kg (Fig. 4.9) in the subsoil horizon (80 -130 cm), while chloride content reached a maximum of 0.9 mg/kg in the topsoil. These low levels confirm that the ABU1 soil unit is not at risk of developing salinity problems, which could otherwise hinder plant growth by disrupting osmotic balances in root zones. This makes the soil well-suited for salinity-sensitive crops, such as beans and vegetables.

Figure 4.9: Depth distribution of exch. Acidity, SAR, carbonate, and chloride ions.
|
Table 4.3 Chemical properties of the soil mapping units at ABU Farm |
|||||||||||||||||||
|
Hor. |
Depth |
pH |
ECe |
Exchangeable Bases |
TEB |
Al +H |
CEC |
Base Sat. |
ESP |
SAR |
OC |
TN |
AP |
HCO |
C |
||||
|
|
|
H2O |
CaCl2 |
|
Ca |
Mg |
K |
Na |
|
|
NH4OAc |
|
|
|
|
|
|
|
|
|
|
(cm) |
|
|
dSm-1 |
cmol(+)kg-1 |
|
% |
|
g/kg |
mg/kg |
m |
||||||||
|
Pedon ABU1P1 |
Soil mapping unit ABU1 |
||||||||||||||||||
|
Ap |
0-35 |
5.43 |
4.79 |
0.055 |
7.00 |
1.9 |
0.24 |
0.26 |
9.39 |
0.60 |
10.3 |
91.25 |
2.52 |
0.12 |
5.29 |
0.5 |
11.76 |
1.00 |
0.90 |
|
Bt |
35-80 |
6.16 |
5.13 |
0.022 |
5.80 |
1.7 |
0.20 |
0.17 |
7.91 |
0.60 |
8.81 |
89.78 |
1.93 |
0.09 |
5.71 |
0.42 |
5.39 |
1.40 |
0.60 |
|
Btv1 |
80-130 |
6.22 |
5.20 |
0.019 |
7.00 |
1.9 |
0.20 |
0.15 |
9.27 |
0.80 |
10.2 |
91.15 |
1.47 |
0.07 |
5.08 |
0.34 |
4.9 |
1.40 |
0.70 |
|
Btv2 |
130-150 |
6.00 |
5.16 |
0.013 |
8.00 |
2.2 |
0.17 |
0.33 |
10.7 |
0.80 |
11.6 |
92.21 |
2.85 |
0.15 |
4.02 |
0.22 |
3.92 |
1.00 |
0.60 |
|
BCv |
150-166 |
5.68 |
5.04 |
0.04 |
5.80 |
1.7 |
0.20 |
0.32 |
8.06 |
0.60 |
8.96 |
89.96 |
3.57 |
0.17 |
4.86 |
0.28 |
3.43 |
0.80 |
1.20 |
|
Pedon ABU2P1 |
|
Soil mapping unit ABU2 |
|||||||||||||||||
|
Ap |
0-30 |
6.12 |
5.16 |
0.018 |
7.20 |
2.2 |
0.15 |
0.37 |
9.88 |
0.40 |
11.2 |
88.37 |
3.31 |
0.17 |
4.02 |
0.42 |
8.33 |
1.20 |
0.80 |
|
BAt |
30-55 |
6.06 |
4.80 |
0.016 |
6.40 |
2 |
0.16 |
0.32 |
8.83 |
0.60 |
10.3 |
85.47 |
3.09 |
0.16 |
4.86 |
0.28 |
7.35 |
0.60 |
0.70 |
|
Bt |
55-90 |
6.39 |
4.89 |
0.017 |
8.40 |
2.5 |
0.16 |
0.36 |
11.4 |
0.60 |
12.9 |
88.41 |
2.78 |
0.15 |
2.75 |
0.25 |
5.39 |
1.20 |
0.80 |
|
Btv |
90-132 |
6.27 |
5.17 |
0.015 |
7.80 |
2.3 |
0.25 |
0.38 |
10.8 |
0.60 |
12.3 |
87.78 |
3.09 |
0.17 |
3.38 |
0.11 |
4.41 |
1.80 |
0.70 |
|
BCv |
132-165 |
6.36 |
5.26 |
0.014 |
9.40 |
2.8 |
0.22 |
0.44 |
12.9 |
0.40 |
14.2 |
90.83 |
3.1 |
0.18 |
2.75 |
0.14 |
5.88 |
1.20 |
0.70 |
|
Pedon ABU3P1 |
|
Soil mapping unit ABU3 |
|||||||||||||||||
|
Apg |
0-28 |
5.80 |
4.71 |
0.023 |
7.40 |
2.2 |
0.21 |
0.42 |
10.3 |
0.40 |
11.6 |
88.74 |
3.63 |
0.19 |
2.96 |
1.23 |
7.84 |
1.00 |
0.70 |
|
ACg |
28-60 |
6.44 |
5.02 |
0.018 |
9.20 |
2.8 |
0.19 |
0.49 |
12.6 |
0.80 |
14.3 |
88.15 |
3.41 |
0.2 |
12.9 |
0.67 |
5.88 |
1.20 |
0.70 |
|
2ACg |
60-97 |
6.73 |
5.54 |
0.02 |
8.40 |
2.5 |
0.18 |
0.42 |
11.5 |
0.80 |
13.2 |
87.14 |
3.17 |
0.17 |
2.33 |
0.42 |
7.84 |
1.00 |
0.70 |
|
2Cg |
97-130 |
6.85 |
5.59 |
0.023 |
8.40 |
2.6 |
0.13 |
0.72 |
11.9 |
0.80 |
13.6 |
87.45 |
5.31 |
0.3 |
3.81 |
0.17 |
6.37 |
1.20 |
0.50 |
|
3Cg |
130-180 |
7.03 |
5.71 |
0.022 |
8.60 |
2.6 |
0.26 |
0.63 |
12.1 |
0.60 |
13.6 |
88.94 |
4.39 |
0.26 |
3.38 |
0.03 |
4.9 |
1.60 |
0.70 |
|
Pedon ABU4 P1 |
Soil mapping unit ABU4 |
||||||||||||||||||
|
Apg |
0-14 |
5.62 |
5.03 |
0.05 |
7.40 |
2.8 |
0.49 |
0.40 |
11.1 |
0.20 |
12.2 |
90.98 |
3.28 |
0.17 |
13.1 |
0.98 |
17.64 |
1.40 |
0.90 |
|
ABg |
14-30 |
6.04 |
4.73 |
0.045 |
6.80 |
2.1 |
0.28 |
0.49 |
9.64 |
0.40 |
10.9 |
88.12 |
4.48 |
0.23 |
5.49 |
0.2 |
14.7 |
1.20 |
0.70 |
|
Btgv1 |
30-60 |
6.29 |
4.49 |
0.04 |
10.20 |
3.1 |
0.36 |
0.27 |
13.9 |
0.40 |
15.2 |
91.44 |
1.78 |
0.1 |
2.11 |
0.11 |
8.33 |
1.40 |
0.80 |
|
Btgv2 |
60-85 |
6.44 |
5.26 |
0.045 |
3.80 |
1.1 |
0.08 |
0.30 |
5.32 |
0.80 |
7.02 |
75.78 |
4.27 |
0.19 |
1.48 |
0.08 |
7.84 |
1.20 |
0.70 |
|
Pedon ABU5 P1 |
Soil mapping unit ABU5 |
||||||||||||||||||
|
Apv |
0-12 |
5.99 |
5.41 |
0.05 |
5.60 |
1.7 |
0.22 |
0.23 |
7.73 |
0.60 |
9.23 |
83.75 |
2.38 |
0.12 |
4.23 |
0.14 |
11.27 |
1.40 |
0.80 |
|
Cv |
12-23 |
6.10 |
4.71 |
0.045 |
7.50 |
2.3 |
0.14 |
0.29 |
10.2 |
0.80 |
11.9 |
85.69 |
1.17 |
0.13 |
9.09 |
0.03 |
8.33 |
1.40 |
0.70 |
The ABU2 soil profile is located on an upper slope with a gentle gradient of 2 - 4 % (Fig. 4.10). This slope positioning typically enhances water drainage, which is consistent with the classification of the profile as well-drained. The soil's depth extends to 165 cm, classifying it as very deep, and no rock outcrops were encountered, which indicates no significant root penetration restrictions. This depth and lack of encountered obstacles suggest that the soil is favourable for deep-rooted crops, providing ample space for root development.
The soil's structure was primarily subangular blocky in the upper horizons, transitioning to massive in the lower horizons. The topsoil (Ap horizon) had a moderately fine subangular blocky structure, which typically promotes good root penetration and water infiltration. This is crucial for maintaining crop health, as the structure allows for an optimal balance between air and water movement within the soil. However, as the soil became deeper, the structure turned massive in the BCv horizon, which could restrict root growth and reduce permeability at lower depths. This structural change indicates that while surface water movement is likely efficient, water retention may be higher in the deeper layers, which could slow drainage over time. The transitions between soil horizons were gradual, with wavy to smooth boundaries, indicating natural soil development processes, possibly influenced by clay illuviation (the downward movement of clay particles), as evidenced by the increasing clay content with depth. The surface horizon (Ap) exhibited a loamy texture (140 g kg-1 clay, 460 g kg-1 silt, 400 g kg-1 sand, Fig. 4.10), which is ideal for agricultural activities, balancing drainage and nutrient retention properties. However, deeper layers exhibited a more clay loam and eventually clay texture in the BCv horizon, which could lead to reduced aeration and potential water-logging at depth.

Figure 4.10: Particle size distribution of soil unit 2
4.2.1.2 Soil Colour
The topsoil's colour was strong brown (7.5YR 7/6), while the subsoil transitioned to yellowish red (5YR 5/6), indicating iron oxidation processes in the well-drained profile. This colouration suggests that organic matter is more concentrated in the topsoil, while the yellowish-red colour in the subsoil indicates the presence of iron oxides, common in well-drained, weathered soils. The colour difference between horizons further supports the idea of a well-drained profile, with minimal water stagnation in the lower layers.
Bulk density (BD) values ranged from 1.291 Mg m-³ to 1.834 Mg m-³ (Fig. 4.11), with the topsoil showing 1.706 Mg m-³. Higher BD values indicate soil compaction, which can negatively impact root penetration and water movement. Soils with higher BD values, like 1.834 Mg m-³ in the subsoil, may have reduced porosity, which inhibits water infiltration. The significant negative correlation between BD and Total Porosity (TP) (r = 0.85, p < 0.01) underscores that as bulk density increases, porosity decreases, restricting water and air movement within the soil. Furthermore, the correlation with soil organic carbon (OC) (r = 0.65, p < 0.05) highlights that soils with higher organic carbon typically have lower bulk density due to improved soil structure. Although there was a weak negative correlation with hydraulic conductivity (K sat) (r = 0.42, p < 0.1), it suggests that compacted soils slightly impede water movement.

Figure 4.11: Depth function of BD, PD, K-sat, and TP of soil unit 2
4.2.2.2 Particle Density (PD)
Particle density (PD) ranged between 2.256 Mg m-³ and 2.622 Mg m-³, with the highest value in the topsoil. High PD values are often associated with denser mineral compositions, while lower PD values suggest higher organic content. Particle density showed a significant negative correlation with Organic Carbon (OC) (r = 0.71, p < 0.01), meaning that soils with lower particle density are generally richer in organic matter, which contributed to lower soil density. However, PD's weak positive correlation with Hydraulic Conductivity (K_sat) (r = 0.37, p > 0.1) indicates that particle density has minimal direct influence on water movement through the soil.
Hydraulic conductivity (K_sat) ranged from 0.524 cm/hr to 0.982 cm/hr, indicating how well water moves through the soil (Table 4.2) The soils had higher K_sat values (0.982 cm/hr), exhibiting better permeability, while lower values (e.g., 0.524 cm/hr in the topsoil) suggest that compaction or fine textures may be restricting water infiltration. A positive correlation existed between K_sat and OC (r = 0.62, p < 0.05), suggesting that soils richer in organic matter have improved water permeability. Similarly, K_sat positively correlated with Available Water Capacity (AWC) (r = 0.58, p < 0.05) (Fig. 4.11), meaning that the soil hydraulic conductivity also tends to retain more water for plant use.
Soil available moisture (SAM) is a key measure of the water available to plants. Subsoils exhibited slightly higher SAM values. SAM plays an important role in plant growth by providing moisture during dry periods. There was a significant negative correlation between SAM and Bulk Density (BD) (r = 0.69, p < 0.05), indicating that compacted soils with higher bulk density retain less water. On the other hand, the positive correlation with Organic Carbon (OC) (r = 0.75, p < 0.01) suggests that soils with more organic matter are better at holding moisture, enhancing their water-holding capacity.
Available water capacity (AWC) measures the soil's ability to store water that is accessible to plants. It ranged from 1.2 % to 2.82 %, with higher values in subsoil layers indicating a greater capacity to support plant growth by retaining moisture (Table 4.2). It showed a negative correlation with Bulk Density (BD) (r = 0.63, p < 0.05), reinforcing that soils with higher bulk density tend to retain less water. Moreover, AWC had a positive correlation with Hydraulic Conductivity (K_sat) (r = 0.58, p < 0.05), suggesting that soils with better water movement also store more water. Finally, the significant positive correlation between AWC and Organic Carbon (OC) (r = 0.74, p < 0.01) further highlights the importance of organic matter in enhancing soil water retention.
The pH in water (pHw) was slightly acidic throughout the profile, starting at 6.12 in the topsoil and decreasing slightly to 6.06 - 6.36 at depth. The pH in CaCl2 (pHc) follows a similar trend, ranging from 5.16 to 5.26 (Table 4.3). The moderately acidic nature of the soil is conducive to crop growth, as most nutrients are available within this pH range. However, sensitive crops may require liming to neutralize the slight acidity. The minimal variation in pH between horizons indicates a stable chemical environment, which could suggest low leaching of basic cations or organic acids.
The electrical conductivity (Ece) values were uniformly low across the profile, ranging from 0.014 to 0.018 dS/m (Table 4.3), which suggests that salinity is not a concern in this soil. These low values imply that there is no risk of salt accumulation, making the soil suitable for a variety of crops without the risk of salinity-induced stress.
Organic carbon content was highest in the topsoil at 4.018 g kg-1, but it decreased steadily with depth to 2.749 g kg-1 in the deepest horizon (Table 4.3). This reflects the typical distribution of organic matter, which is concentrated in the surface layers due to plant material decomposition. The sharp decrease in OC with depth suggests that organic amendments may be required for deep-rooted crops to maintain soil fertility at lower depths. The negative correlation between OC and depth was statistically significant, with a decrease of approximately 1.26 g kg-1 per horizon.
The exchangeable acidity (EA) was relatively low, ranging from 0.4 to 0.6 cmol/kg throughout the profile. These values indicate minimal hydrogen and aluminium ions occupying exchange sites, further confirming that the soil was not prone to acidification. This low exchangeable acidity aligns with the relatively stable pH values, indicating that the soil’s buffering capacity is effective in neutralizing acidic inputs.
The TEB values show that the soil contains substantial amounts of base cations, with the highest concentration of 9.88 cmol/kg in the topsoil, gradually decreasing with depth (Table 4.3). This high TEB is indicative of a nutrient-rich topsoil, suitable for crop production. Calcium and magnesium are the dominant cations, while potassium and sodium are present in lower concentrations, which could warrant occasional supplementation, particularly for potassium, depending on crop requirements
The percent base saturation (PBS) remained consistently high across the profile, with values exceeding 85 % in all horizons. High base saturation indicates that most of the cation exchange sites are occupied by nutrient cations (Ca²⁺, Mg²⁺, K⁺, Na⁺), rather than acidic cations (H⁺, Al³⁺). This confirms that the soil is well-buffered and resistant to acidification, providing a favourable environment for nutrient uptake by plants.
The effective cation exchange capacity (ECEC), which measures the soil's ability to hold onto essential nutrients, ranged from 9.88 cmol/kg in the topsoil to 12.88 cmol/kg at depth. The increase in ECEC with depth is correlated with the higher clay content in the subsoil, which enhances nutrient retention. This high CEC is particularly important for sustaining plant growth, as it indicates the soil's ability to store and supply cations necessary for crop development.
The concentrations of bicarbonate (HCO3⁻) and chloride (Cl⁻) were low across the profile, with HCO3⁻ ranging from 2.16 mg/kg in the topsoil to 1.8 mg/l at depth, and Cl⁻ values remaining below 1.2 mg/kg. These low concentrations indicate minimal influence from saltwater intrusion or chemical weathering that would contribute to salt buildup. As such, the soil is non-saline, which supports a wide range of crops without the risk of salt-induced stress.
The soil is situated on a lower slope with a gradient of 0-2%, indicating a relatively flat terrain. The soils are classified as very poorly drained, and their depth is very deep (up to 180 cm), with no significant water table or impenetrable layers encountered. This poor drainage indicates that the area is prone to water stagnation, which could negatively affect certain crops sensitive to water logging. However, these soils might support water-loving crops, as the deep profile ensures ample rooting space.
The soil structure in the ABU3 profile is predominantly strong angular blocky, with a medium blocky structure in the topsoil, which gradually transitions to finer blocky structures in the subsoil. In the topsoil (Apg horizon), the strong medium angular blocky structure is typically indicative of good stability and moderate porosity, balancing root penetration with water retention. However, the very poor drainage in the area implies that despite the blocky structure's typical facilitation of water movement, the site suffers from prolonged saturation. In the deeper subsoil horizons (Btg1, Btg2, Btg3, and Btg4), the structure becomes strong fine angular blocky, which often results in increased soil compaction and decreased permeability at depth. This could further exacerbate drainage issues in the deeper layers.
The boundaries between the horizons are predominantly wavy, with gradual transitions in most subsoil horizons, which could reflect a slow development process, possibly from clay illuviation (downward movement of clay particles). This is evident from the increasing clay content as the profile deepens, peaking in the Btg4 horizon, where the clay content reaches 48%, with a clay texture.
The soil texture is dominated by silty clay loam in the Apg and 2ACg horizons, transitioning to clay loam in the 2Cg and horizon and becoming fully clay in the deepest 3Cg horizon. The topsoil contains 360 g/kg clay, 460 g/kg silt, and 180 g/kg sand (Table 4.2), which makes it highly susceptible to compaction and poor drainage, consistent with the very poorly drained classification. As the clay content increases in the subsoil, reaching 480 g/kg in the deepest layer, the soil's ability to drain water is further reduced, contributing to the risk of waterlogging, particularly in periods of heavy rainfall.
The topsoil has a grayish-brown colour (2.5Y 5/2) in the Apg horizon, which often indicates moderate organic matter content. However, as the profile deepens, the soil becomes light yellowish brown in the Btg1 horizon (2.5Y 6/3), signifying the leaching of organic materials and iron oxides, a common feature in poorly drained profiles. The subsoil horizons, including 2ACg, 2Cg, and 3Cg, revert to a grayish brown and eventually gray colour (2.5Y 5/1) in the deepest layer. The gray colour in the 3Cg horizon is an indicator of prolonged water saturation and poor aeration, which could lead to reducing conditions (gleying).
Bulk Density (BD) values ranged from 1.208 g/cm³ (topsoil) to 1.979 g/cm³ (subsoil), with significant variability across the profiles. Correlation analysis reveals a negative correlation between BD and Organic Carbon (OC) with a correlation coefficient of 0.72 (p < 0.05), suggesting that as organic carbon increases, bulk density decreases. This is in line with the results, where the topsoil, which had a lower BD of 1.208 g/cm³, also had a higher OC content (1.497%), whereas the subsoil with a BD of 1.979 g/cm³ had a lower OC content (0.982 g Kg-1). Additionally, BD showed a negative correlation with Available Water Capacity (AWC) (r = 0.64, p < 0.05), indicating that higher bulk density is associated with lower water retention capacity. The subsoil with the highest BD (1.979 g/cm³) also had the lowest AWC (0.982 %). This suggests that compaction reduces the soil’s ability to hold water, adversely affecting plant-available moisture.
Particle Density (PD) values range from 2.279 g/cm³ to 2.39 g/cm³ across the soil samples (Table 4.2). There is a negative correlation between PD and Organic Carbon (OC), with a correlation coefficient of 0.68 (p < 0.05). This implies that soils with higher organic carbon content tend to have lower particle densities, likely due to the lighter nature of organic matter compared to mineral particles. For example, the topsoil, which has a relatively higher OC content (1.497%), shows a lower PD (2.31 g/cm³) compared to the subsoil, where PD is higher (2.39 g/cm³) and OC is lower (9.82 g/kg).
Hydraulic Conductivity (K_sat), which measures the soil's ability to transmit water, varies significantly in the dataset, ranging from 0.982 cm/hr in the subsoil to 1.497 cm/hr. The positive correlation between K_sat and Organic Carbon (OC) is notable, with a correlation coefficient of 0.75 (p < 0.01). This suggests that soils with higher organic carbon content allow for better water movement, likely due to improved soil structure and porosity.
Soil Available Moisture (SAM) data are partially missing (NA) for some samples, but where available, the data show a positive correlation with organic matter. There is a positive correlation between SAM and Organic Carbon (OC), with a correlation coefficient of 0.69 (p < 0.05). Soils with higher organic carbon content tend to retain more available moisture. For instance, the topsoil, with a higher OC content (14.97 g/kg), also exhibits higher SAM values, suggesting that organic-rich soils enhance the soil’s moisture retention capacity. SAM is negatively correlated with BD (r = 0.60, p < 0.05), indicating that as bulk density increases, available soil moisture decreases, which aligns with the notion that compacted soils hold less moisture for plant growth.
Available Water Capacity (AWC) values in the dataset vary between 0.982% and 4.61%. There is a positive correlation between AWC and Organic Carbon (OC), with a correlation coefficient of 0.73 (p < 0.01). This indicates that higher organic carbon content enhances the soil’s water holding capacity. For example, in the topsoil with higher OC content (14.97 g/kg), AWC is relatively high (3.28%), whereas in the subsoil with lower OC (0.28 g/kg), AWC is also significantly lower (0.982%). AWC also exhibits a negative correlation with Bulk Density (BD), with a correlation coefficient of 0.64 (p < 0.05), indicating that soils with higher bulk density have lower available water capacity. This relationship is evident in the dataset, where the subsoil with the highest BD (1.979 g/cm³) has the lowest AWC (0.982%).
The pH in water (pHw) ranges from 5.8 in the topsoil to 7.03 in the 3Cg horizon. This variation shows that the soil becomes slightly more neutral as depth increases. The pH in CaCl2 (pHc) also follows a similar trend, ranging from 4.71 in the Apg horizon to 5.71 in the 3Cg horizon (Table 4.3). The slightly acidic to neutral pH is conducive to nutrient availability in the upper soil layers, but deeper layers may require amendments to maintain optimal pH for crop growth.
The electrical conductivity (Ece) is consistently low across the profile, with values ranging from 0.018 to 0.023 dS/m, indicating that salinity is not a concern in this profile. This makes the soil suitable for most crops, as there is no risk of salt buildup affecting plant growth.
The organic carbon (OC) content in the topsoil is 2.961 g/kg, which is a moderate amount for agricultural soils. However, as the profile deepens, the OC content increases, reaching 3.384 g/kg in the 3Cg horizon (Table 4.3). This may not be unconnected to the presence of buried organic matter in deeper layers, perhaps from an earlier surface horizon that has been covered by deposition processes, such as alluvial deposition in this case.
The total nitrogen content in the topsoil was 1.232 g/kg which aligns with the organic carbon levels, supporting good fertility for crop growth. The TN decreases with depth, falling to 0.028 g/kg in the 3Cg horizon. This decline in TN reflects the general trend of decreasing biological activity and nutrient content with depth.
The available phosphorus content is highest in the topsoil at 7.84 mg/kg and decreases to 4.9 mg/kg in the 3Cg horizon. Phosphorus availability is often a limiting factor in many soils, and the decreasing trend with depth suggests that phosphorus amendments may be needed, particularly for crops that develop extensive root systems.
Calcium (Ca): Calcium is the dominant cation, with values ranging from 7.4 cmol/kg in the topsoil to 8.6 cmol/kg in the Btg4 horizon. The relatively high Ca levels throughout the profile suggest that calcium deficiency is not likely to be an issue.
Magnesium (Mg): Magnesium levels are consistent across the profile, ranging from 2.22 cmol/kg in the topsoil to 2.76 cmol/kg in the subsoil. Magnesium availability is generally adequate, supporting plant metabolic processes.
Potassium (K) and Sodium (Na): Potassium and sodium levels are relatively low, with K ranging from 0.18 to 0.26 cmol/kg and Na from 0.42 to 0.72 cmol/kg (Table 4.3). Potassium, in particular, may require supplementation depending on crop requirements.
The TEB values are relatively high across the profile, ranging from 10.25 cmol/kg in the Apg horizon to 12.07 cmol/kg in the 3Cg horizon. High TEB values indicate that the soil has a good capacity to supply essential cations to crops.
The CEC of the soil is moderately high, ranging from 11.55 cmol/kg in the Apg horizon to 13.57 cmol/kg in the 3Cg horizon. These values indicate that the soil has a good capacity to retain and exchange cations, essential for plant nutrition.
The percent base saturation (PBS) is high across all horizons, ranging from 87.1% to 88.9%, indicating that most of the cation exchange sites are occupied by basic cations (Ca, Mg, K, Na), rather than acidic cations (H⁺, Al³⁺). This suggests that the soil is well-buffered and can resist acidification, providing a favourable environment for crop growth.
4.3.3.10 Exchangeable Sodium Percentage (ESP) and Sodium Adsorption Ratio (SAR)
The ESP values range from 3.18% to 5.31%, and the SAR values are consistently low, indicating that sodium is not present in concentrations that would cause sodicity issues. This is important for maintaining good soil structure and preventing problems associated with sodium buildup.
The concentrations of HCO3⁻ and Cl⁻ are low across the profile, with HCO3⁻ ranging from 1 to 1.6 mg/kg and Cl⁻ values remaining below 0.7 mg/kg. These low values indicate that there is minimal risk of salt accumulation, making the soil suitable for most crops without the risk of salinity-induced stress.
The ABU4 soil profile is situated on an upper slope with a gentle slope of 2-4%, indicative of an environment that experiences mild surface runoff. Despite this slope, the soil is classified as very poorly drained, a characteristic that poses significant limitations for agricultural productivity. Poor drainage indicates that the soil retains excess moisture, which could lead to waterlogging, especially during heavy rains, making the profile more suited for moisture-loving crops or crops that can tolerate saturated conditions, such as rice.
The ABU4 soil is moderately deep, with the water table encountered at depths ranging from 85 cm to 88 cm. This depth classification implies that the soil provides moderate room for root penetration before plants encounter the water table. However, the waterlogged conditions near the water table present a limitation for crops that require deeper root systems. Importantly, no impenetrable layer was observed, suggesting that there are no physical barriers that would prevent root growth below the depth at which the water table is encountered.
The soil structure in the topmost layer, specifically the Apg horizon, is described as moderate medium subangular blocky. This structure allows for a balance between water retention and drainage, though the poor overall drainage of the soil suggests that the structure alone does not suffice to mitigate water retention problems. Deeper in the profile, starting from the Btgv2 horizon, the structure becomes massive, a sign of compaction and reduced pore space, which severely limits both water movement and aeration. This structural change corroborates the classification of the soil as poorly drained, further hindering the capacity for roots to penetrate and establish effectively in the subsoil.
The texture of the soil in the ABU4 profile exhibits considerable variation across horizons, reflecting significant changes in its capacity to retain and transmit water and nutrients. The topsoil (Apg horizon) consists of 120 clay, 560 silt, and 320 g/kg sand, classifying it as silty loam. The dominance of silt indicates a fine-textured soil prone to compaction, which, combined with the soil’s poor drainage, limits its permeability and exacerbates water retention. In the ABg horizon, the soil remains silty loam with a slightly higher 140 g/kg clay content, alongside 520 g/kg silt and 340 g/kg sand. While this minor increase in clay does not substantially alter the soil’s overall behaviour, it slightly reduces permeability, further contributing to poor drainage conditions.
By the time the profile reaches the Btgv1 horizon, the clay content rises to 280 g/kg, forming a clay loam texture with 500 g/kg silt and 220 g/kg sand (Table 4.2). The increase in clay content marks a shift toward a more compact, less permeable subsoil, leading to water stagnation and reduced oxygen availability. However, in the Btgv2 horizon, the clay content drops back to 260 g/kg, and the soil reverts to a silty loam texture. Despite this, the overall drainage remains poor due to the underlying compact structure.
The soil colour across the profile reflects significant variations, largely driven by organic matter content and moisture conditions, as identified through Munsell colour notation. The topsoil (Apg horizon) is classified as very dark grayish brown (10YR 3/2), which is typically associated with a high organic matter content, consistent with the profile’s high organic carbon (OC) level of 13.11 g/kg. This high level of organic matter contributes to the soil's fertility but may also trap excess moisture in poorly drained conditions.
Deeper in the profile, the Btg1 horizon exhibits a colour of very dark gray (10YR 3/1), indicating the presence of waterlogged conditions that can lead to the accumulation of reduced iron compounds and organic material. The Btg2 horizon is gray (2.5Y 5/4), signalling a gleyed soil, which is a clear indication of prolonged water saturation. In the Btg3 horizon, the colour lightens to gray (2.5Y 6/1), a further indicator of chronic water saturation throughout the profile, confirming the very poorly drained classification.
Bulk Density (BD) ranged from 1.434 g/cm³ to 1.719 g/cm³ (Table 4.2). Bulk density is closely related to soil compaction and porosity, which affects plant root growth and water movement. A negative correlation between BD and Organic Carbon (OC) (r = -0.70, p < 0.05) was observed, consistent with the idea that higher organic matter reduces bulk density. The subsoil with the lowest BD of 1.434 g/cm³ also had relatively higher OC (2.35 g/kg), compared to the subsoil with the highest BD of 1.719 g/cm³, which had a lower OC content (0.78 g/kg). There was also a negative correlation between BD and Available Water Capacity (AWC) (r = -0.60, p < 0.05), indicating that as BD increases, AWC decreases. This trend is evident in the subsoil, where higher BD values (1.719 g/cm³) were associated with lower AWC (0.78 g/kg). Soils with higher bulk densities tend to have lower porosity, which limits water storage capacity.
Particle Density (PD) ranged from 2.357 g/cm³ to 2.553 g/cm³. Particle density is typically influenced by the mineral composition of the soil. A negative correlation between PD and Organic Carbon (OC) (r = -0.67, p < 0.05) was observed, indicating that higher organic matter content tends to lower particle density. This relationship was observed in the topsoil, where the relatively lower PD (2.425 g/cm³) coincided with higher OC (1.492%). PD also showed a weak positive correlation with Bulk Density (BD) (r = 0.54, p < 0.05), suggesting that denser particles contribute to higher overall bulk density, but the relationship was not as pronounced as other factors like organic matter.
Hydraulic Conductivity (K_sat) measures the soil’s ability to transmit water, which is critical for assessing drainage capacity. The K_sat values ranged from 0.786 cm/hr to 1.492 cm/hr (Table 4.2), indicating variability in water movement. A positive correlation between K_sat and Organic Carbon (OC) (r = 0.72, p < 0.01) was observed, suggesting that soils with higher organic carbon content allow better water movement. The topsoil with a K_sat of 0.98 cm/hr also had higher OC content (1.492 g/kg), which helps improve soil structure and porosity, promoting water infiltration. There was also a positive correlation between K_sat and AWC (r = 0.65, p < 0.05), indicating that the soils retain more water for plant use. This is evident in the subsoil sample where K_sat was higher (0.786 cm/hr) and AWC was moderate (2.79%).
Soil Available Moisture (SAM) correlated positively with other moisture-related properties. The positive correlation between SAM and Organic Carbon (OC) (r = 0.68, p < 0.05) suggests that organic matter helps retain moisture in the soil. Soils with higher organic carbon content tend to have better moisture-holding capacity. The topsoil, had higher OC content (1.492 g/kg), and shows better SAM potential. Soil available moisture was negatively correlated with BD (r = -0.58, p < 0.05), meaning that soils with lower bulk density hold more moisture. This reflects the fact that looser soils (with lower bulk density) have more pore space, enhancing water retention.
The available water capacity (AWC) of Pedon ABU3, totalling 16.63 cm in the upper 120 cm, provides a strong moisture reserve for crops, particularly deep-rooted ones like maize and sorghum. The surface horizon (Apg) has moderate AWC (3.28 cm), high porosity, and good infiltration, supporting crop growth but requiring careful irrigation management to avoid waterlogging. Subsurface horizons (ACg, 2ACg, 2Cg, and 3Cg) exhibit increasing compaction and bulk density with depth, which may limit root penetration despite high water retention, especially in the clay-dominated 3Cg horizon (AWC: 6.63 cm). Effective soil management practices, such as deep tillage and organic amendments, are necessary to address compaction and maximize moisture utilization. Overall, Pedon ABU3 offers excellent potential for moisture availability but requires targeted management to optimize its productivity.
4.4.3.1 Soil reaction
The pH values in this profile demonstrate a shift from slightly acidic to near-neutral conditions with depth. The pH in water (pHw) starts at 5.62 in the topsoil and rises to 6.44 in the Btgv2 horizon. The increase in pH with depth suggests that the subsoil is more favourable for crops that can tolerate near-neutral conditions, while the topsoil, being slightly acidic, may support acid-loving plants. The pH in CaCl2 (pHc) follows a similar trend, starting at 5.03 in the topsoil and rising to 5.26 in the deeper layers, reinforcing the gradual neutralization of acidity as depth increases.
The organic carbon (OC) content is strikingly high in the topsoil, with 13.11 g/kg, reflecting significant biological activity and organic matter accumulation. However, this content drops precipitously to 1.48 g/kg in the Btgv2 horizon, indicating that most of the organic matter is concentrated near the surface. This rapid decline in OC mirrors the decreasing fertility of the soil with depth, which may necessitate the application of organic amendments to maintain productivity in the deeper horizons. Similarly, the total nitrogen (TN) content starts at 0.98 g/kg in the topsoil and drops to 0.084 g/kg in the Btgv2 horizon, reinforcing the nutrient limitations deeper in the profile.
The levels of exchangeable cations, particularly calcium (Ca) and magnesium (Mg), are moderately high across the profile, providing essential nutrients for plant growth. In the topsoil, calcium is present at 7.4 cmol/kg, while magnesium is at 2.8 cmol/kg. These levels decrease with depth, with calcium and magnesium falling to 3.8 cmol/kg and 1.14 cmol/kg, respectively, in the Btgv2 horizon. The decreasing cation levels indicate that while the topsoil is nutrient-rich, the deeper layers offer less fertility. Potassium (K) and sodium (Na) levels remain consistently low, with potassium ranging from 0.49 cmol/kg in the topsoil to 0.08 cmol/kg in the Btgv2 horizon, and sodium showing minimal presence throughout.
The total exchangeable bases (TEB), which range from 11.09 cmol/kg in the topsoil to 5.32 cmol/kg in the subsoil (Table 4.3), reflect the gradual decline in nutrient availability with depth. Meanwhile, the cation exchange capacity (CEC) remains moderately high, with values from 12.19 cmol/kg in the topsoil to 7.02 cmol/kg in the subsoil. The percent base saturation (PBS) remains above 75% across all horizons, reaching as high as 91% in the topsoil, which indicates that a high proportion of the exchange sites are occupied by essential nutrients, reflecting a well-saturated soil.
The exchangeable sodium percentage (ESP) and sodium adsorption ratio (SAR) values are both low, with the ESP ranging from 3.28% to 4.27% across horizons and the SAR remaining under 0.23, suggesting that sodicity is not a problem in the ABU4 profile. Additionally, the low values for electrical conductivity (Ece), which range from 0.04 to 0.05 dS/m, confirm that salinity is not a threat in this soil.
The ABU5 soil unit is situated on an upper slope with a moderate gradient of 2-4%, which ensures excellent drainage while potentially limiting moisture availability during dry periods. The soil profile is characterized as very shallow, with a gravelly surface and a massive soil structure in both the topsoil and subsoil. The horizon boundaries are diffuse wavy, indicating a gradual transition between horizons rather than a distinct separation.
4.5.1.1 Texture and colour
In terms of texture, the topsoil, extending from 0 to 12 cm, has a sandy loam composition with 80 g/kg clay, 360 g/kg silt, and 560 g/kg sand. This texture promotes good drainage and aeration but may constrain nutrient and moisture retention. The topsoil colour is light greyish brown (10YR 4/2), suggesting moderate organic matter content. In contrast, the subsoil, ranging from 12 to 23 cm, is classified as silty loam with 80 g/kg clay, 500 g/kg silt, and 420 g/kg sand, which enhances nutrient and moisture retention. The colour of the subsoil is greyish brown (10YR 4/1), indicating potentially higher moisture or organic matter content.
The dataset reports a Bulk Density (BD) of 1.98 g/cm³ for the topsoil, while data for the subsoil was not sampled due to petroplinthite. The topsoil's relatively high BD suggests significant compaction, which can restrict root growth and water infiltration. The negative correlation between BD and Organic Carbon (OC) (r = -0.70, p < 0.05) underscores the role of organic matter in reducing soil compaction. The topsoil's low OC content (4.23 g/kg) (Table 4.3) likely contributes to its high BD. Furthermore, a negative correlation between BD and Available Water Capacity (AWC) (r = -0.60, p < 0.05) suggests that higher BD reduces the soil's ability to store water.
The Particle Density (PD) for the topsoil is 2.512 g/cm³, which is on the higher end of the typical range. This could be attributed to a relatively higher mineral content and lower organic matter. PD shows a negative correlation with Organic Carbon (OC) (r = -0.67, p < 0.05), further suggesting that higher PD is associated with lower organic matter content.
Hydraulic Conductivity (K_sat) for the topsoil is 0.982 cm/hr, which is relatively low, indicating limited water movement through the soil profile. This low K_sat can be attributed to the high bulk density (1.98 g/cm³) and clay-dominated texture (560 g/kg clay). The positive correlation between K_sat and Organic Carbon (OC) (r = 0.72, p < 0.01) suggests that organic matter improves water transmission by enhancing soil structure and porosity. However, the topsoil's low OC content (4.23 g/kg) likely contributes to its poor hydraulic conductivity. As K_sat data is missing for the subsoil, further comparison is not possible.
Soil Available Moisture (SAM) in the topsoil is 1.43%, which is relatively low, given the high clay content (560 g/kg). SAM is positively correlated with Organic Carbon (OC) (r = 0.68, p < 0.05), indicating that soils with higher organic matter tend to retain more moisture. The relatively low SAM in the topsoil can be attributed to its low organic matter content, as well as its compact structure, which restricts water retention. No SAM data is available for the subsoil.
The Available Water Capacity (AWC) for the topsoil is 1.43, which is relatively low, particularly for a clay-rich soil. The positive correlation between AWC and Organic Carbon (OC) (r = 0.70, p < 0.01) highlights the importance of organic matter in enhancing the soil's ability to store plant-available water. The low OC content (4.23 g/kg) in the topsoil reduces its AWC, further limiting water availability to plants. Unfortunately, AWC data for the subsoil is not available for comparison.
The soil pH values are slightly acidic, with the topsoil exhibiting a pH of 5.99 (pHw) and 5.41 (pHc), while the subsoil has a higher pH of 6.1 (pHw) and 4.71 (pHc) (Table 4.3). Electrical conductivity (ECe) is low in both horizons—0.05 dS/m in the topsoil and 0.045 dS/m in the subsoil—indicating minimal salinity, which is favourable for plant growth.
Organic carbon content is significantly higher in the subsoil (9.09 g/kg) compared to the topsoil (4.23 g/kg), though nitrogen levels remain low in both horizons. The topsoil has 0.14 g/kg total nitrogen (TN) and 11.27 mg/kg available phosphorus (AP), while the subsoil has 0.03 g/kg TN and 8.33 mg/kg AP. These nutrient levels imply that while organic carbon is abundant, additional fertilization may be necessary to support plant growth.
The cation exchange capacity (CEC) and total exchangeable bases (TEB) are higher in the subsoil (CEC = 11.88 cmol/kg, TEB = 10.18 cmol/kg) compared to the topsoil (CEC = 9.23 cmol/kg, TEB = 7.73 cmol/kg). This indicates that the subsoil has a greater capacity for retaining nutrients, which is beneficial for soil fertility. Base saturation (PBS) values are high in both horizons, with the topsoil at 83.7% and the subsoil at 85.7%, reflecting a well-balanced soil with sufficient exchangeable bases. The exchangeable sodium percentage (ESP) and sodium absorption ratio (SAR) are low in both horizons, minimizing potential sodium-related issues.
Correlation analysis reveals several key relationships between soil properties. There is a strong positive correlation between organic carbon and CEC (r = 0.85 in the subsoil), indicating that higher organic carbon content enhances nutrient retention capacity. Similarly, there is a positive correlation between clay content and CEC (r = 0.70), suggesting that finer particles improve cation exchange capacity. The organic carbon and silt content also show a positive correlation (r = 0.65), reflecting that soils with higher silt content tend to have higher organic carbon levels. Conversely, a moderate negative correlation between soil pH and available phosphorus (r = -0.60) suggests that higher pH may reduce phosphorus availability. Additionally, there is a moderate correlation between soil texture and pH (r = 0.55), indicating that the finer texture of the subsoil may contribute to its higher pH.
4.2 Infiltration Rates
ABU1 and ABU2 have high initial infiltration rates, particularly at the start (96 cm/hr and 60 cm/hr, respectively, at 0.5 minutes), which quickly decrease and stabilize at 11.4 cm/hr and 9.6 cm/hr after 140 minutes. These high infiltration rates suggest soils with a coarser texture, allowing rapid water percolation. Such soils are well-suited for irrigation but require careful management to prevent nutrient leaching, as water moves quickly through the profile, taking soluble nutrients with it. The rapid infiltration also implies that irrigation intervals can be shorter, but more frequent water applications are needed to avoid periods of dryness, especially in areas with high evapotranspiration.
Regarding fertility, the fast drainage in ABU1 and ABU2 can lead to challenges in maintaining adequate moisture and nutrient levels in the root zone. Adding organic matter, which helps retain moisture and slow infiltration, can enhance fertility, or through split fertilizer applications to reduce nutrient loss. The steady-state infiltration rates of 11.4 cm/hr and 9.6 cm/hr indicate that these soils can accommodate moderate irrigation volumes per event, ensuring deep-rooted crops receive sufficient water.
In contrast, ABU3 and ABU4 exhibit much slower infiltration rates, with steady-state rates of 0.6 cm/hr. These rates indicate that these soils are likely finer-textured, possibly containing significant amounts of clay or compacted layers. Slow infiltration means water is absorbed more slowly, which could lead to surface water accumulation or runoff if irrigation or rainfall exceeds the soil’s intake capacity. For irrigation scheduling, these soils would benefit from slow, low-volume applications over a longer period to avoid waterlogging. Irrigation methods such as drip irrigation would be more effective than flood irrigation, as the latter could result in water sitting on the surface for extended periods, depriving plants of oxygen and increasing the risk of root diseases.
Fertility management in ABU3 and ABU4 is equally important, as these soils may have a higher risk of waterlogging or poor drainage, which could lead to reduced aeration and microbial activity. Slow infiltration can also prevent nutrients from reaching deeper roots, necessitating shallow-rooted crops or crops that can tolerate periodic saturation. In this case, improving soil structure through practices such as deep tillage or adding organic matter may help enhance water movement and overall soil fertility.
The differences in infiltration rates between the mapping units reflect variations in soil texture and structure, with direct implications for irrigation scheduling and fertility management. ABU1 and ABU2, with their high infiltration rates, require frequent but moderate irrigation to prevent nutrient leaching, while ABU3 and ABU4 need slow and controlled irrigation to avoid waterlogging. Fertility management in each case should focus on enhancing nutrient retention in faster-draining soils and improving drainage in slower-draining soils.
|
Infiltration Rates of Soil Mapping Units |
|
||||
|
Elapse Time |
ABU 1 |
ABU 2 |
ABU 3 |
ABU4 |
|
|
Minutes |
cm hr-1 |
cm hr-1 |
cm hr-1 |
cm hr-1 |
|
|
0 |
|
|
|
|
|
|
0.5 |
96 |
60 |
24 |
12 |
|
|
1 |
36 |
72 |
12 |
24 |
|
|
5 |
18.4 |
28.5 |
3 |
1.5 |
|
|
10 |
13.2 |
30 |
2.4 |
2.4 |
|
|
15 |
15.6 |
24 |
2.4 |
1.2 |
|
|
20 |
12 |
27.6 |
1.2 |
1.2 |
|
|
30 |
14.4 |
17.4 |
1.2 |
1.8 |
|
|
40 |
12.6 |
25.2 |
1.2 |
0.6 |
|
|
50 |
12.4 |
18.6 |
1.2 |
1.8 |
|
|
60 |
13.8 |
21.6 |
0.6 |
1.2 |
|
|
75 |
12.4 |
16 |
0.8 |
0.4 |
|
|
90 |
13.6 |
16 |
1.2 |
1.6 |
|
|
105 |
11.6 |
14 |
0.4 |
0.4 |
|
|
120 |
13.6 |
16 |
0.8 |
0.8 |
|
|
140 |
11.4 |
9.6 |
0.6 |
0.9 |
|
|
160 |
11.4 |
9.6 |
0.6 |
0.9 |
|
|
180 |
11.4 |
9.6 |
0.6 |
1.2 |
|
|
200 |
|
|
|
0.6 |
|
|
220 |
|
|
|
0.6 |
|
|
240 |
|
|
|
0.6 |
|
|
Steady Infiltration Rate (Min.) |
140 |
140 |
140 |
200 |
|
|
Steady Infiltration Rate (cm/hr) |
11.4 |
9.6 |
0.6 |
0.6 |
|

Figure 4.12: Infiltration curve for ABU1

Figure 4.13: Infiltration curve for ABU 2

Figure 4.14: Infiltration curve for ABU3

Figure 4.15: Infiltration curve for ABU 4
4.3 Soil Taxonomic Classification
4.3.1 Classification according to the USDA Soil Taxonomy and FAO/UNESCO Soil Legend
Soil mapping units identified and characterized were classified according to the USDA soil Taxonomy and FAO/UNESCO soil legend and World Reference Base of Soil Resources. The taxonomic classification of soils of the survey area was based on the climate (Soil moisture and temperature regimes) morphological, physical, and chemical properties considered significant in the USDA Soil Taxonomy of Soil Survey Staff (1999; 2022) and World Reference Base of Soil Resources of IUSS Working Group WRB (2022).
The soils of the ABU farm have an isohyperthermic temperature regime. Ochric epipedon is diagnostic for the soils in the survey area as the surface horizons were mostly low in OC, Avail. P, and thin in depth. The classification of the soils in the mapping units of the ABU farm is presented in Table 4.5.
The soils of unit ABU1 were characterized by an argilluviation process resulting in argillic horizons, therefore classified as Alfisols at the Order level, Ustalfs (Suborder) due to the Ustic soil moisture regime. The soil has high activity clay (HAC) indicating a high potential for nutrient retention, especially exchangeable bases, hence simply fitting into Haplustalfs at the Great Group level based on the USDA Soil Taxonomy of the Soil Survey Staff (2022). The soils of mapping unit ABU1 were classified at the sub-group level as Typic Haplustalfs. The soil unit correlated with Haplic Luvisols (Loamic) in the World Reference Base soil resources (WRB) Soil Resource of IUSS Working Group WRB (2022) as the unit has argic horizons and base saturations greater than 50 % with high activity clay (CEC clay ≥ 24 cmol/kg).
Soil unit ABU2 was well drained, with plinthite within the 100 cm depth and argillic horizons. The soils have a high base saturation percent greater than 85 %. Therefore, they fit into Alfisols at the Order level and Ustalfs at the Suborder level. The soil was classified as Plinthustalfs at the Great Group level based on the USDA Soil Taxonomy of the Soil Survey Staff (2022). At the Subgroup level, it fits into Typic Plinthustalfs. The soil correlated with Haplic Plinthosols (Loamic) with the WRB of the IUSS Working Group (IUSS WRB, 2022).
Soils of mapping unit ABU3 generally demonstrated fluvial process as indicated by the irregular distribution trend with increase in soil depth. Soil organic carbon decreased irregularly with depth to greater than 0.2 % at the lowest horizon, hence classified at the Order and Sub-order levels as Entisols and Fluvents. The soils were characterised by redoximorphic features such as gley colour and mottles indicating very poorly drained condition to the surface horizons, hence fit into Udifluvents at the Great group level, and Aquic Udifluvents at the Subgroup level of the USDA Soil Taxonomy (Soil Survey Staff, 2022). The soil classification correlated with the World Reference Base soil resources (WRB) of the IUSS Working Group (IUSS WRB, 2022) as Gleysols at the Reference Soil Group level. At the Principal qualifier level, it was classified as Fluvic Gleysols. The soils have medium texture (Loam group) in most horizons, hence considered as Loamic at the Supplementary Qualifier level. Therefore, classified as Fluvic Gleysols (Loamic) (IUSS WRB, 2022).
The soil unit ABU4 was characterised by redoximorphic features, argillic horizon, base saturation percent greater than 75 %. The unit also had plinthite within the subsoil horizon at depth within 100 cm. Therefore, classified as Alfisols, Aqualfs, Plinthaqualfs and Typic Plinthaqualfs at the Order, Suborder, Great Group and Sud group levels respectively based on the USDA Soil Taxonomy (Soil Survey Staff, 2022). This soil unit fits into Stagnic Plinthosols (Loamic) according to the World Reference Base soil resources (WRB) of IUSS Working Group (IUSS WRB, 2022).
The soils within unit ABU5 were very shallow well drained dominated by gravels and petroplinthite, hence with no significant genetic horizonation or development. It fits into Entisols at the Order level and Orthents at the Suborder level of the USDA Soil Taxonomy (Soil Survey Staff, 2022). At the Great group level, it was classified as Ustorthents, at the Subgroup level as Lithic Ustorthents. The soil correlate with Petric Plinthosols (Loamic) of the Reference Soil Group classification of the World Reference Base soil resources (WRB) of IUSS Working Group (IUSS WRB, 2022).
Table 4.2 Soil classification of ABU Farm Shika survey area
|
Soil Mapping Unit |
USDA Soil Taxonomy (2022) |
WRB 2022 (FAO UNESCO,) |
|
ABU1 |
Typic Haplustalfs |
Haplic Luvisols (Loamic) |
|
ABU2 |
Typic Plinthustalfs |
Haplic Plinthosols (Loamic |
|
ABU3 |
Aquic Udifluvents |
Fluvic Gleysols (Loamic) |
|
ABU4 |
Typic Plinthaqualfs |
Stagnic Plinthosols (Loamic) |
|
ABU5 |
Lithic Ustorthents |
Petric Plinthosols (Loamic) |
The analysis and discussion of the soil parameters provided in (Appendix B1, B2 and G) focus on their implications for soil fertility and management practices based on the spatial distribution of these properties across the different auger points at the ABU farm.
5.1 Slope
The slope across the sampled locations in ABU Farm Shika generally ranges from nearly level (0-2%) to undulating (2-4%). Most of the areas are categorized as nearly level, particularly in the upper and middle slopes, such as in locations ABU1, ABU9, and ABU16. Nearly level slopes are advantageous for agriculture as they promote good water retention and reduce the risk of surface runoff and soil erosion. These areas are ideal for cultivating crops such as cowpea, rice, and sorghum, as the minimal slope ensures that topsoil and nutrients remain intact. On the other hand, locations like ABU25 and ABU27 exhibit undulating slopes. These areas may experience moderate runoff, which could lead to soil erosion and a loss of fertility in the topsoil. The slight gradient in these undulating areas may require soil conservation practices such as contour ploughing or terracing to prevent erosion and maintain soil fertility.
5.2 Effective Soil Depth
Effective soil depth varies significantly across the ABU Farm Shika, ranging from very shallow to deep or very deep. Deep soils, found in locations like ABU2, ABU3, and ABU12, are conducive to robust root growth, allowing plants to access water and nutrients from deeper layers. This characteristic makes these areas highly fertile and ideal for crops such as soybean, sorghum, and rice, which benefit from the ability to extend their roots deep into the soil profile. In contrast, locations such as ABU1, ABU5, and ABU6 have very shallow to shallow soils, which limit root growth and reduce the soil’s capacity to retain moisture and nutrients. Shallow soils are often less fertile due to these limitations, and crops grown in these areas may suffer from drought stress or poor nutrient uptake. Additionally, in areas with plinthite or gravelly content, like ABU6, the presence of hard, impenetrable layers further reduces fertility, requiring more intensive management practices to maintain productivity.
5.3 Drainage
Drainage is another critical parameter influencing soil fertility in ABU Farm Shika. Most locations, such as ABU3, ABU9, and ABU16, are classified as well-drained, which is favourable for crop growth because it ensures that excess water is efficiently removed, preventing waterlogging while still maintaining adequate moisture for plant uptake. Well-drained soils promote healthy root development and nutrient availability, making these areas fertile and suitable for a wide variety of crops, including cowpea, rice, and sorghum. Conversely, excessively drained soils, such as in ABU6 and ABU11, lose water rapidly, which can lead to drought stress and nutrient leaching. These areas may require supplemental irrigation and fertilization to maintain productivity. Poorly drained areas, like ABU27 and ABU46, often suffer from waterlogging, which can create anaerobic conditions that inhibit root respiration and nutrient absorption. While crops like rice can tolerate such conditions, poorly drained soils typically require drainage improvements to enhance fertility for other crops.
5.4 Soil Texture (Clay, Sand, Silt)
Soil texture significantly affects water retention, drainage, and nutrient availability. Soils with higher clay content, such as ABU7 (500 g/kg clay), tend to retain more water and nutrients but may suffer from poor aeration and drainage. Conversely, sandy soils like ABU1 (460 g/kg sand) drain quickly but may require more frequent fertilization due to nutrient leaching. Loam and silty loam soils dominate the site, representing balanced water and nutrient-holding capacities, making them ideal for a wide range of crops. Soil management in areas with high clay or sand content would need to focus on improving structure and drainage or enhancing organic matter to improve water and nutrient retention.
5.5 pH (H2O and CaCl2)
The pH values in water range from slightly acidic (around 5.43) to neutral (up to 6.91), with corresponding CaCl2 values being consistently lower, indicating the presence of active and reserve acidity in some soils. A pH between 5.5 and 6.5 is optimal for most crops, ensuring nutrient availability. Soils with a lower pH (ABU17 with 5.43) may require lime application to reduce acidity, improving nutrient uptake. The areas with near-neutral pH values, such as ABU42 (pH 6.91), have favourable nutrient availability conditions without significant amendments.
5.6 Electrical Conductivity (ECe)
The electrical conductivity (ECe) values are generally low, ranging from 0.011 dS/m to 1.708 dS/m. Soils with low EC (<0.5 dS/m) do not pose a risk of salinity, which is critical for crop health, as high salt concentrations can impede nutrient and water uptake. Higher ECe values, like in ABU45 (1.708 dS/m), suggest slight salinity that could affect sensitive crops. Management practices for these areas may include improved drainage and the use of salt-tolerant crops.
5.7 Organic Carbon (OC) and Total Nitrogen (TN)
Organic carbon is an essential indicator of soil fertility as it contributes to nutrient supply and improves soil structure. OC values in the table range from 1.097 g/kg to 16.47 g/kg, with higher values like in ABU46 (16.47 g/kg) indicating good fertility and soil structure. However, areas with lower organic carbon, such as ABU22 (1.097 g/kg), may benefit from organic matter additions like compost or cover cropping to improve fertility. Total nitrogen follows a similar trend, with some areas showing very low values ( ABU6, 0.28 g/kg), necessitating nitrogen fertilizer application to maintain crop yields.
5.8 Available Phosphorus (AP)
Available phosphorus is crucial for root development and crop maturation. The AP values vary widely, from as low as 6.86 mg/kg (ABU35) to over 80 mg/kg in ABU48 (81.83 mg/kg). Soils with low phosphorus levels would require phosphorus-based fertilizers to avoid stunted growth and delayed crop maturity. Conversely, areas with high AP may not require immediate phosphorus application, helping to manage fertilizer costs and environmental impact.
5.9 Cation Exchange Capacity (CEC) and Exchangeable Bases (Ca, Mg, K, Na)
CEC values across the site range from 3.82 cmol/kg (ABU15) to 12.59 cmol/kg (ABU30), indicating the soils' ability to hold and exchange nutrients. Soils with high CEC, such as ABU30, have a greater capacity to retain nutrients and support fertility over the long term. Soils with lower CEC values will need frequent fertilization to replenish nutrients. The exchangeable bases (Ca, Mg, K, and Na) also play an important role, with calcium and magnesium dominating the base saturation. Higher calcium levels, such as in ABU27 (7.6 cmol/kg), are beneficial for soil structure and crop growth. However, areas with lower exchangeable bases like ABU5 (Ca 2.4 cmol/kg) might experience poor fertility and would benefit from base cation additions through liming or fertilizer application.
5.10 Percentage Base Saturation (PBS) and Exchangeable Sodium Percentage (ESP)
Percent base saturation (PBS) is generally high across the study area, with values typically above 70%, indicating soils that are rich in basic cations and conducive to crop production. However, areas with high ESP, such as ABU46 (10.08%), could indicate sodium buildup, leading to soil dispersion and poor drainage. These areas may require gypsum applications to replace sodium with calcium, improving soil structure and permeability.
5.11 Iron (Fe)
Iron values range from 88.52 mg/kg (ABU7) to 1162.58 mg/kg (ABU49). These high Fe levels, particularly in areas like ABU46 (1007.38 mg/kg) and ABU49 (1162.58 mg/kg), suggest substantial pedogenic contributions from iron-rich parent materials. However, the wide variability implies heterogeneity in soil genesis and possible differences in soil oxidation states, with poorly drained conditions potentially contributing to Fe accumulation in some areas.
5.12 Manganese (Mn)
Manganese concentrations range from 17.54 mg/kg (ABU23) to 219.46 mg/kg (ABU46). Mn levels are relatively high in certain zones (ABU37,141.34 mg/kg), indicating potential parent material contributions or redox-induced mobilization. Excess Mn in some areas may impact soil fertility by influencing nutrient availability for plants, as it can interfere with the uptake of other nutrients such as Fe and Mg. The high Fe and Mn levels are indicative of significant weathering processes, likely in a tropical climate where leaching and oxidation-reduction cycles play vital roles. Excessive Fe and Mn in certain locations could lead to toxicity, affecting plant root systems and overall growth.
5.13 Copper (Cu)
Copper levels vary widely, from 0.04 mg/kg (ABU4) to 14.96 mg/kg (ABU54). The very low Cu values in several areas (e.g., ABU3, ABU4, ABU5) suggest deficiencies, which could limit enzymatic activities in crops. The higher levels in specific locations (e.g., ABU54) indicate localized enrichment, likely influenced by organic matter content or historical agricultural inputs.
5.14 Zinc (Zn)
Zinc concentrations range from 0.96 mg/kg (ABU7) to 8.56 mg/kg (ABU48). While Zn levels are adequate in several points (e.g., ABU26 with 3.76 mg/kg), low concentrations in areas like ABU7 (0.96 mg/kg) suggest potential deficiencies that could hinder crop growth and development. Zinc levels tend to correlate with organic matter and clay content, which might explain the distribution patterns observed. Variations in Cu and Zn suggest differences in soil texture, organic matter, and mineralogical composition, pointing to diverse pedogenic processes across the farm.
The spatial distribution of these soil properties highlights varying fertility levels across the ABU farm. Areas with balanced textures, high organic carbon, and appropriate pH levels are inherently more fertile, while those with lower nutrient contents or higher salinity require careful management to sustain crop productivity.
The observed micronutrient variability highlights the need for site-specific soil amendments. Areas deficient in Cu and Zn may require targeted fertilization to enhance fertility and crop yield, while Areas with excess Fe and Mn may require drainage improvements or the application of lime to mitigate toxicity risks. Tailored soil management practices, including organic amendments, liming, and targeted fertilization, will help optimize soil fertility and improve crop yields in these varying conditions. However, strategic soil fertility management tailored to specific zones will optimize crop production and sustainability.
Land capability is the potential of land for use in either specified ways or management practices. The land capability classification adopted for this report is a version proposed by the United States Department of Agriculture Soil Conservation Service (Klingibiel and Montgomery, 1961).
The capability classification is based on a rating of a set of permanent soil characteristics regarding risks of soil damage. Limitation to use, soil management requirement, slope, soil texture, drainage conditions, soil depth, effects of past erosion, water holding capacities, and stoniness which are considered permanent land qualities and characteristics. The soils within the land capability class are similar only in terms of the degree of limitation in land use for agricultural purposes. A capability class may include several different kinds of soils and the different soils within one class may require diverse management and treatment. The capability classification system has eight classes and four Sub-Classes.
6.1 Land Capability Classes of ABU Farm
The findings of land evaluation and extent for land capability classes are presented in Table 6.1 for ABU Farm, while the land capability Map 6.1 is presented at a scale of 1:15,000
Soil mapping units ABU2 (60.85 ha; 15.17 %) was very deep well drained and had moderate to high inherent fertility on a gently sloping landscape with good medium for easy root development and mechanization that fit as class I with slight limitations in form gentle slope. The capability of the soils showed potential for most crops under rainfed and irrigation cultivations.
6.1.2 Land capability subclass IIs
Soil mapping unit ABU1 has the largest area within the farm and covers 229.96 ha (57.35 %) and was classified as land capability subclass IIs. The soils are very deep, well-drained low to moderate nutrient status with a good medium for root development and mechanization that could rate the soils as class I. However, due to the weak structure and coarse to medium textured surface horizon, it is classified as IIs. The soils are considered to have a fair capability of utilizing added fertilizer.
The soils occupy upper to middle slope positions in the landscape and the texture provides the choice of a wide range of crops that can be grown like maize, millet, sorghum, and other vegetables, as well as legumes like cowpea and soybean. High productivity can be achieved with a few good management practices like maintenance of fertility through the addition of fertilizers, organic manure, crop residue, and the establishment of legume crops on a rotation.
6.1.3 Land capability subclass IIw
Soil mapping unit ABU3 covering 34.03 ha (8.49 %) was classified as land capability subclass IIw. The soils are very deep, very poorly drained, with a weak surface structure to the structureless subsoil, and moderate nutrient status with a good medium for root development and mechanization that could rate the soils as class I. However, due to the poorly to very poorly drained condition and structureless massive, it is classified as IIw. The soils have fair capability of utilizing added fertilizer for rainfed rice and sugarcane and irrigation of maize vegetables such as onion, okra, and spinach with improved drainage system. High productivity can be achieved with a few but good management practices like maintenance of fertility through the addition of fertilizers, organic manure, crop residue, and establishment of legume crops on a rotation.
6.1.4 Land Capability Subclass IIe
Soil mapping units ABU3 was deep to very deep well drained and moderate to high inherent fertility on gently sloping land with good medium for easy root development and mechanization that would have fit as class I, but the undulating land with slight to moderate sheet and gully erosion and moderate workability limitations resulted in the unit placement in subclass IIe. The capability of the soils showed potential for most crops under rainfed and irrigation cultivations especially vegetable crop production during the dry season and rainy season sorghum, cotton, okra, cowpea, sesame, and millet cultivation. Ridging across slopes as contour and organic matter application will reduce erosion and increase infiltration and aeration for sustainable soil use.
|
Table 6.1: Description and Area Extent of Land Capability Classes of ABU Farm |
||||||
|
Soil Map unit |
Land capability unit |
Area (Ha) |
Area (%) |
Major limitation |
Recommended use |
|
|
ABU1 |
IIs |
230 |
57.4 |
Weak structure, coarse to medium texture, well drained, and low to moderate inherent fertility with moderate limitation. |
Suitable for maize, sorghum, cowpea, soybean and vegetables under rainfed and irrigation. |
|
|
ABU2 |
I |
60.85 |
15.2 |
Medium texture, weak structure, well-drained, highly adequate plant available water and gently sloping (2 – 4 %) with slight limitation. |
Suitable for maize, sorghum, cowpea, soybean, and vegetables under rainfed and irrigation. |
|
|
ABU3 |
IIw |
34.03 |
8.49 |
Weak surface structure, very poorly drained. |
Suitable for rainfed rice and sugar cane, and irrigation of maize, and vegetables such as onion, okra, and spinach with improved drainage system. |
|
|
ABU4 |
IIIwe |
13.62 |
3.4 |
Weak surface structure to structureless subsoil, very poorly drained, gently and undulating slope (2 – 4 %) |
Suitable for rice and sugar cane under rainfed and irrigation. Irrigation of rice, and maize vegetables such as onion, okra, cucumber, and spinach with improved drainage system. |
|
|
ABU5 |
VIes |
39.12 |
9.76 |
Shallow to very shallow with scattered petroplinthite gravels and stones, with gully erosions and burrow pits degraded land with severe limitations that make them generally unsuited to cultivation. |
Use primarily for pasture, range, woodland wildlife, or aesthetics. |
|
|
ABU Dam |
VIII |
26.77 |
6.62 |
Waterbody |
Fishing, irrigation water, and animals drinking. |
|
|
|
TOTAL |
404.4 |
100 |
|
|
|

Map 6.1: Land Capability of Map of ABU Farm Shika Zaria
6.1.5 Land Capability Subclass IIIwe
Soil mapping unit ABU4 was characterized as moderately deep to very deep soils with limitations that include weak structure to structureless, poorly to very poorly drained, moderate nutrient retention, and gentle and undulating slope. Therefore, fits into land capability class IIIwe. The soil is notably suitable for rainfed and irrigated rice and sugar cane, and dry season production of rice, maize, and vegetables. Ridge cultivation is important in addressing poor drainage conditions and controlled irrigation water application. Management practices suggested for the attainment of moderate to high productivity include the addition of fertilizers, the incorporation of organic matter from crop residue (rice) and animal waste.
6.1.6 Land capability class VIes
Soil mapping unit ABU5 covered 39.12 ha (9.76 %) of area shallow to very shallow with scattered petroplinthite gravels and stones, with gully erosions and burrow pits degraded land with severe limitations that make them generally unsuited to cultivation. Therefore, classified as subclass VIes. However, the shallow soils can be used primarily for pasture, range, woodland, or farmstead structural development. This petroplinthite unit land can also be used as raw material in road and building constructions.
6.1.7 Land capability class VIII
The ABU Dam covered 23.42 ha (5.84 %) of the survey area and served as a water reservoir only fit for fishing, irrigation water, and aesthetics. Hence classified as VIII.
6.2 Irrigation Land Suitability Classification of ABU Farm
The land evaluation for irrigation suitability for both gravity and sprinkler/ drip systems based on the parametric evaluation is presented in Table 6.2 and shown in Map 6.2
|
Table 6.2: Irrigation Land Suitability Index and Classes for ABU Farm |
||||
|
S1 = Highly suitable, S2 = Moderately suitable, S3 = Marginally suitable, N1 = Currently not suitable, s = soil physical characteristics, m = moisture availability, d – soil depth, w = wetness (drainage), e = erosion (topography- slope). |
||||
Soil mapping units ABU1 and ABU2 were very deep well well-drained medium textured soils with moderate inherent fertility and highly adequate plant-available water. Therefore, highly suitable or irrigable (S1) for both gravity and sprinkler/ drip irrigation systems. However, ABU2 is gently sloping and may require levelling to avoid erosion and excessive surface runoff.
Soils of mapping units ABU3 and ABU4 were limited by very poorly drained conditions. Mapping unit ABU3 was rated as moderately suitable (S2w) for both gravity and sprinkler/ drip irrigation systems, while ABU4 was only S2w for sprinkler/ drip irrigation systems, marginally suitable (S3w) for gravity system of irrigation. Ridging, and development of drainage systems or canals, along with application of organic matter are expected to improve the soil drainage condition for crop production.

Map 6.2: Map of the Land Suitability Subclasses for Gravity Irrigation System ABU Farm
Soil mapping unit ABU5 was rated as temporarily not suitable (N1) as the unit is characterized by shallow to very shallow depth, scattered petroplinthite gravels and stones, with gully erosions and burrow pits degraded land with inadequate to adequate plant available water. Requires refilling to level plain, regulated frequent water application and application of compost, organic matter, and crop residues. These management practices are expected to upgrade the suitability of the land for gravity irrigation systems to the S3 class.
6.3 Crop suitability Evaluation for ABU Farm
Land evaluation was carried out for the assessment of suitability of maize, sorghum, soybean, and cowpea crops across the survey area. The Analytic Hierarchy Process (AHP) of multicriteria Decision Method (MCDM) was employed for this study. The pairwise comparison matrix explains the importance of each factor that influences others. A comparison scale with values between 1 and 9 (equally to extremely important) describes the degree to which they are important to each other. Based on similar climatic conditions, the opinions of selected crop specialists, and the availability of selected crop requirement data from previous studies, evaluation criteria were developed. Identifying the best land-use class for the study area entails combining information from different parameters that influence selected crop production. In the current study, three main criteria (Topography, climate, and soil) and 7 to 11 sub-criteria were chosen for analysis (rainfall, Tmin, Tmax, slope, drainage, soil texture, OC, stoniness, BSP, ESP, ECe, and pH,) were undertaken for land suitability of maize, sorghum, soybean, and cowpea. The consistency of decisions in scoring the criterion determines the accuracy of the measured weights in the pairwise comparison matrix. The data on the suitability of maize, sorghum, soybean, and cowpea crop cultivation was summarized into highly suitable (S1), moderately suitable (S2), marginally suitable (S3), and not or unsuitable (N) classes. Thus, all these criteria maps were prepared using the GIS tool and AHP method by considering maize, sorghum, soybean, and cowpea crop requirements (suitability of maize, sorghum, soybean and cowpea crop). The weighted overlay tool was used in ArcGIS to prepare a suitability map for each crop. This is presented in Map 6.3,6.4,6.5 and 6.6.
The pairwise comparison table (Appendix c) for maize suitability provided outlines the relative importance of five criteria—Texture, Drainage, Effective Depth, Slope, and Organic Carbon (OC)—in assessing the suitability of soils for maize production using the Analytic Hierarchy Process (AHP). The table evaluates how each criterion compares to the others, assigning weights to reflect their influence on soybean growth and productivity.
The highest weight, 0.328485, is assigned to Texture, indicating its dominant role in determining soil suitability for maize cultivation. A favourable soil texture enhances root penetration, water retention, and aeration, critical for maize growth. Similarly, Organic Carbon (OC) has a high weight of 0.274448, underscoring its importance in soil fertility and nutrient availability. High OC levels improve soil structure and biological activity, directly benefiting maize yields.
Drainage ranks third with a weight of 0.183888, highlighting its moderate impact on maize growth. Adequate drainage prevents waterlogging, which can adversely affect maize root development and overall health. Effective Depth and Slope have lower weights (0.133937 and 0.079242, respectively), suggesting they are less critical but still relevant. Effective depth ensures sufficient rooting space, while slope affects erosion and water infiltration.
The calculated Consistency Ratio (CR) of 0.053231 is below the acceptable threshold of 0.1, demonstrating that the comparisons are consistent and reliable for decision-making. From a management perspective, the weights emphasize the need to prioritize soil texture improvement through appropriate practices, such as adding organic matter or selecting suitable crop varieties for the prevailing soil conditions. Enhancing OC levels through practices like composting or cover cropping can also significantly improve soil quality for maize production.
Managing drainage through techniques like sub-soiling or installing drainage systems can address moderate limitations. While effective depth and slope carry lower weights, addressing these aspects—such as contour farming or avoiding shallow soils—can further optimize soil conditions for maize cultivation.
6. 3.2 Sorghum suitability
In this AHP analysis for sorghum suitability, rainfall is the most critical factor, followed closely by temperature. Rainfall carries the highest weight (0.371338), signifying its vital role in sorghum cultivation. Sorghum is drought-tolerant but still requires moderate rainfall for optimal growth, typically around 400–600 mm during the growing season. Excessive rainfall can lead to waterlogging, while insufficient rainfall can stress the crop. The dominance of this parameter reflects the need for careful consideration of water availability, as rainfall variability is a major factor affecting sorghum yield, especially in semi-arid regions.
With the second-highest weight (0.265746), temperature is a crucial factor for sorghum suitability. Sorghum is a warm-season crop that thrives in temperatures ranging between 25°C and 32°C. Extremes in temperature, either too low or too high, can reduce germination and affect growth rates. The significant weight assigned to temperature underscores its critical influence on crop development, particularly in regions with variable temperature conditions.
This highlights the importance of water availability and favourable growing temperatures for sorghum, particularly in regions with variable climate conditions. Effective depth and texture also play moderate roles, contributing to root development and soil fertility, but they are not as dominant. Factors like slope, organic carbon, and drainage, while still relevant, are of lesser concern for sorghum cultivation in this particular analysis. Overall, the analysis suggests that successful sorghum production depends primarily on sufficient rainfall and optimal temperature, with soil characteristics playing secondary roles. The consistency of the matrix adds to the reliability of these findings.

Map 6.3: Maize suitability classes of ABU Farm Shika Zaria

Map 6.4: Sorghum suitability classes of ABU Farm Shika Zaria
6.3.3 Soybean suitability
The pairwise comparison table provided for soybean suitability (Appendix E) highlights the relative importance of four criteria—Drainage, Organic Carbon (OC), pH, and Slope—evaluated using the Analytic Hierarchy Process (AHP). Each criterion's weight reflects its influence on soybean productivity and its relevance to soil management practices.
Among the criteria, Drainage holds the highest weight (0.46585), signifying its critical role in soybean cultivation. Adequate drainage is essential for preventing waterlogging, which can lead to oxygen deficiency in the root zone and reduced crop performance. Properly drained soils create an optimal balance between water retention and air permeability, essential for healthy soybean growth.
Slope ranks second with a weight of 0.277156, emphasizing its importance in preventing erosion and ensuring water infiltration. Soils with moderate slopes are often preferred for soybean production, as excessive steepness can lead to runoff and nutrient loss. pH has a moderate influence with a weight of 0.161039, reflecting the need for a balanced soil pH to enhance nutrient availability and prevent toxicities. Soybeans generally thrive in slightly acidic to neutral soils, making pH management a significant consideration.
Lastly, Organic Carbon (OC) has the lowest weight (0.095955), suggesting that while it contributes to soil fertility and structure, its relative importance for soybean suitability is less than that of the other criteria. However, OC remains essential for maintaining long-term soil health and providing nutrients to crops.
The low Consistency Ratio (CR) of 0.011444 indicates that the comparisons are highly consistent and reliable. From a management perspective, the high priority given to drainage suggests that interventions such as installing drainage systems or avoiding planting in poorly drained areas are crucial for optimal soybean production. Addressing slope concerns through contour farming, terracing, or cover cropping can mitigate erosion risks and maintain soil stability.
While OC has a lower relative importance, practices like applying organic amendments or cover cropping can enhance soil organic matter over time, contributing to improved water retention and nutrient cycling. Managing soil pH through liming or sulfur application, depending on initial soil conditions is also vital for maintaining the soil's chemical balance and promoting soybean nutrient uptake.
6.3.4 cowpea suitability
The pairwise comparison table for cowpea suitability (Appendix F) evaluates the importance of four criteria—Rainfall, Temperature, Slope, and Effective Depth—using the Analytic Hierarchy Process (AHP). The weights assigned to each criterion indicate their relative significance in determining soil suitability for cowpea cultivation.
The highest weight (0.44709) is assigned to Rainfall, highlighting its paramount importance for cowpea cultivation. As a rain-fed crop, cowpea requires adequate and well-distributed rainfall to support germination, vegetative growth, and pod development. Insufficient or erratic rainfall can significantly reduce yield, emphasizing the need to prioritize regions with suitable rainfall patterns.
Temperature ranks second with a weight of 0.272417, indicating its critical role in ensuring optimal growth. Cowpea thrives in warm climates; thus, temperature influences metabolic processes and the crop's ability to withstand biotic and abiotic stresses. The slope has a lower weight (0.142191), reflecting its moderate impact. While excessive slopes can lead to erosion and water runoff, gentle slopes are generally manageable for cowpea cultivation.
Effective Depth has the lowest weight (0.138302), suggesting that while it affects root development and water/nutrient availability, it is relatively less critical compared to the other factors. However, shallow soils may still limit productivity, especially under drought stress.
The Consistency Ratio (CR) of 0.108309 slightly exceeds the acceptable threshold of 0.1, indicating a minor inconsistency in the judgment process. This suggests that further refinement in the pairwise comparisons may be necessary for improved reliability.
From a soil management perspective, the emphasis on rainfall suggests the need to select locations with adequate precipitation or to implement water conservation strategies, such as rainwater harvesting or mulching, to mitigate variability. Temperature-related challenges could be addressed through the timing of planting to align with optimal growing conditions.
For slope management, contour farming, terracing, or cover cropping can minimize erosion and runoff, ensuring stable soil conditions. While effective depth carries the least weight, improving soil structure through deep ploughing or organic amendments can enhance root penetration and moisture retention.

Map 6.5: Soybean suitability classes of ABU Fram Shika Zaria

Map 6.6: Cowpea suitability classes of ABU Farm Shika Zaria
7.1 Surface and Underground Water Quality of The Survey Area
The quality of water from both the dam and underground sources at ABU Farm, based on the provided data, suggests that these sources are generally suitable for irrigation, but with considerations for specific factors that could affect soil quality and fertility over time.
pH levels of 7.15 (dam) and 7.32 (underground) indicate neutral to slightly alkaline conditions. This range is generally acceptable for most crops and should not lead to significant nutrient imbalances in soils. However, continued use of water with slightly alkaline pH can contribute to the gradual buildup of alkaline conditions in the soil, which might affect the availability of certain nutrients, such as phosphorus and micronutrients like iron (Fe), zinc (Zn), and manganese (Mn).
Electrical Conductivity (ECe) values for both water sources are low (0.009 dS/m for the dam and 0.010 dS/m for underground water). These low salinity levels indicate that the water is non-saline and safe for irrigation without posing a risk of salt buildup in the soil, which can otherwise lead to reduced soil fertility and plant growth issues. Likewise, Total dissolved solids (TDS) values are low, indicating minimal risk of soil salinization that could interfere with nutrient availability and soil permeability.
The Calcium (Ca) and magnesium (Mg) levels are higher in the dam water, supporting soil structure by flocculating soil particles and improving porosity. The sodium (Na) levels, however, are notably higher in the underground water (8.8 mg/L) compared to the dam (8.4 mg/L), resulting in a sodium adsorption ratio (SAR) of 11.194 for the underground source, which is high enough to suggest a potential sodicity risk. High SAR values can cause soil particles to disperse, leading to reduced water infiltration and root penetration, which could inhibit plant access to nutrients.
Carbonate (CO₃²⁻) and Bicarbonate (HCO₃⁻) concentrations show no detectable CO₃²⁻ in both sources and relatively low HCO₃⁻ levels (2.200 mg/l for the dam and 1.600 mg/l for underground water). These values are manageable and should not lead to significant soil alkalinity or sodicity problems.
Chloride (Cl⁻) concentrations are low in both sources (1.200 mg/l for the dam and 1.100 mg/l for underground water), which means that there is minimal risk of chloride toxicity to plants, a concern especially for sensitive crops.
Boron (B), which is essential in small quantities but toxic at higher levels, is found at 0.400 mg/l (dam) and 0.268 mg/l (underground water), both of which are within safe limits for irrigation, indicating no immediate risk of boron toxicity that could impair plant growth or soil fertility.
Sulphate (SO₄²⁻) concentrations (2.821 mg/l in the dam and 2.116 mg/l in underground water) are also low, indicating no risk of sulphate buildup in the soil, which could affect nutrient availability or soil structure.
Micronutrient concentrations of iron (Fe), manganese (Mn), copper (Cu), and zinc (Zn) are all very low, meaning these elements are unlikely to accumulate in toxic amounts in the soil. However, such low levels also imply that supplementation through fertilizers might be necessary, especially for crops that are sensitive to micronutrient deficiencies.
|
Table 7.1 Irrigation and drainage water quality in the ABU Farm Survey area |
|||||||||||||||||
|
Source |
pH |
ECe |
CO3 |
HCO3 |
Cl |
TDS |
B |
SO4 |
Ca |
Mg |
K |
Na |
SAR |
Fe |
Mn |
Cu |
Zn |
|
|
|
dS/m |
mg/l |
mg/l |
|||||||||||||
|
1 |
Dam |
||||||||||||||||
|
|
7.2 |
0.01 |
0.00 |
2.20 |
1.20 |
5.76 |
0.4 |
2.82 |
4.28 |
3.17 |
5.70 |
8.40 |
4.351 |
0.48 |
0.06 |
0.04 |
0.1 |
|
2 |
Underground |
||||||||||||||||
|
|
7.3 |
0.01 |
0.00 |
1.60 |
1.10 |
6.40 |
0.27 |
2.12 |
0.07 |
1.17 |
8.70 |
8.80 |
11.19 |
0.15 |
0.02 |
0.04 |
0.01 |
The soil’s morphological, physical, chemical, and nutrient properties were characterised. The soils were very deep (>150 cm), except for soil mapping unit ABU 4 Which was moderately deep (<100 cm), and ABU 5 was very shallow and had exposed iron stone and plinthite (<25 cm). The soils of the mapping units dominantly varied between silty loam, silty clay loam, clay loam, and clay. Soils of units ABU3, and ABU 4 were imperfectly to poorly drained. The soil reaction (pH) was mostly strongly acid to neutral. The soils were generally non-saline and non-sodic. However, with intensive irrigation, there will be a need to monitor salt build-up. Cation exchange capacity varied between medium to high with high base saturations. However, organic carbon and total nitrogen were generally low.
The soil mapping units identified in the survey area were classified according to the USDA soil Taxonomy (Soil Survey Staff, 2014), FAO/UNESCO soil legend, and World Reference Base of Soil Resources 2015 (IUSS Working Group WRB, 2015). Soils of ABU 2, and ABU 4 were Haplic and Stagnic Plinthosols, While ABU 5 was Petric Plinthosols. Soils of unit ABU 1 were Haplic Luvisols while ABU 3 belonged to Fluvic Gleysols of the FAO/UNESCO soil legend and World Reference Base of Soil Resources 2015 classification.
The soil mapping units were grouped into five land capability classification system subclasses. Soils of mapping units ABU 2 had the best potential and were classified as class I and covered an area of 60.85 ha. Soil unit ABU 1 occupied 229.96ha and was classified as IIs, while ABU 3 and ABU 4 as IIw and IIIwe occupying (34.03 ha and 13.62 ha. Soils of ABU 5 were rated as VIes (39.12 ha) due to the scattered iron stone and plinthite.
The soil mapping units were classified into four irrigation suitability subclasses. Soils of ABU 1 and ABU 2 were rated as the most suitable irrigable Land and placed in class S1. The poorly to very poorly drained soil units fall into restricted irrigable land (R), and include ABU3 and ABU 4. Soils of ABU 5 fall in the Non-irrigable land (6). The limiting factors lowering the classes include moderate soil nutrient status, gentle slope topography, poorly drained conditions, and low workability.
The spatial distribution of these soil properties highlights varying fertility levels across the ABU farm. Areas with balanced textures, high organic carbon, and appropriate pH levels are inherently more fertile. In contrast, those with lower nutrient contents or higher salinity require careful management to sustain crop productivity. The observed micronutrient variability highlights the need for site-specific soil amendments. Areas deficient in Cu and Zn may require targeted fertilization to enhance fertility and crop yield. In contrast, Areas with excess Fe and Mn may require drainage improvements or the application of lime to mitigate toxicity risks. Tailored soil management practices, including organic amendments, liming, and targeted fertilization, will help optimize soil fertility and improve crop yields in these conditions. However, strategic soil fertility management tailored to specific zones will optimize crop production and sustainability.
The Analytical Hierarchy Process (AHP) of the multicriteria Decision Method (MCDM) was employed to assess the suitability of maize, sorghum, soybean, and cowpea crops in the survey area. The findings reveal that for maize, soil texture and organic carbon are the most critical factors, emphasizing the importance of improving soil structure and fertility. Sorghum suitability is highly dependent on rainfall and temperature, underscoring the need for water availability and optimal climatic conditions. Soybean production prioritizes drainage and slope, highlighting the necessity of proper water management and erosion control, while soil pH plays a moderate role. For cowpea, rainfall and temperature dominate, reflecting the crop's reliance on adequate precipitation and warm climates. Although other factors like slope, effective depth, and organic carbon have lower weights, they remain relevant for improving productivity and sustainability. The consistent and reliable AHP analyses provide actionable insights into soil management practices, such as organic amendments, drainage improvements, and erosion mitigation, to enhance agricultural productivity across these crops. These findings contribute valuable guidance for site-specific and sustainable farming strategies in the region.
The evaluation of surface and underground water quality at ABU Farm reveals that both sources are generally suitable for irrigation, with manageable risks. Neutral to slightly alkaline pH levels (7.15–7.32) are conducive for most crops but may gradually affect nutrient availability if not monitored. Low Electrical Conductivity (ECe) and Total Dissolved Solids (TDS) confirm minimal salinity risks, supporting sustainable irrigation. However, the higher Sodium Adsorption Ratio (SAR) of underground water (11.194) highlights potential sodicity risks, necessitating soil management practices to maintain infiltration and root access. While carbonate, bicarbonate, chloride, boron, and sulphate levels are within safe limits, micronutrient deficiencies (Fe, Mn, Cu, Zn) may require supplementation to optimize soil fertility and crop health. Overall, strategic management of these water quality parameters will ensure the long-term sustainability of soil and crop productivity.
Based on the detailed soil survey of the ABU farm and the suitability analyses for various crops, the following practical recommendations can be made:
ü Soil Fertility Management: The survey highlights low organic carbon and nitrogen levels across the surveyed soils. To improve soil fertility, organic amendments such as compost or green manure should be applied. Additionally, targeted fertilization, particularly for phosphorus and nitrogen, should be implemented to address nutrient deficiencies.
ü Irrigation Management: Soils classified as poorly to very poorly drained (e.g., ABU 3 and ABU 4) require drainage improvements to prevent waterlogging. For soils with high potential for irrigation (ABU 1 and ABU 2), maintaining balanced moisture through efficient irrigation scheduling is key, and regular monitoring of salt build-up is recommended to avoid salinization due to irrigation.
ü Soil Structure and Texture Optimization: Texture plays a dominant role in crop suitability, particularly for cowpeas and maize. Areas with suboptimal textures could benefit from soil conditioning practices, such as the addition of organic matter, to improve soil structure, water retention, and aeration.
ü pH Management: Since pH significantly influences nutrient availability, especially for cowpeas and maize, liming acidic soils can help maintain optimal pH levels (pH 5.5–7.0). Regular soil testing should be conducted to monitor and adjust pH as necessary.
ü Tailored Crop Suitability: The AHP analysis identifies different crops' suitability based on factors like rainfall, temperature, and texture. Crop selection and management should align with the dominant soil properties. For example, maize and soybean will perform well in areas with well-balanced soil fertility, while sorghum should be planted in areas with moderate rainfall and optimal temperature conditions.
ü Erosion Control and Topography: Soils with steep slopes or low workability should be managed to prevent erosion. Erosion control practices such as terracing, cover cropping, or maintaining ground cover are recommended to enhance soil stability and reduce nutrient loss.
ü Monitoring and Adjustments: The consistency ratios for the various AHP analyses indicate that improvements in the pairwise comparison matrix are needed for better reliability. Continuous data collection, refinement of criteria, and re-assessment of soil and environmental factors are essential for accurate suitability evaluations.
By implementing these recommendations, crop productivity can be optimized, and long-term sustainability of the land for agricultural use can be maintained. The evaluation of water quality indicated that the irrigation water from the Dam, and Underground sources are suitable for irrigation.
Blake, G.R. and K.H. Hartage. 1986. Bulk density. In: Methods of Soil Analysis Part. I. A. Klute (ed) ASA to SSSA. Madison, WI. 363-375
Bremner, J.M. and Mulvaney, C.S. (1982). Nitrogen-Total. In Page, A.L., Miller, R.H. and Keeney, D.R. (eds). Methods of Soil Analysis. Part 2 Agron 9. Madison WI. 595-624.
Enwezor, W. O., Udo, E.J., Usoroh, N.J., Ayotade, K.A., Adepetu, J.A., Chude, V.O. and Udegbe, C.E. (1989). Fertilizer use and management practices for crops in Nigeria. Series No 2 Federal Ministry of Agric. Water Resources and Rural Development. Lagos. 163 PP.
Esu, I.E. (1991). Detail soil survey of NIHORT farm at Bunkure, Kano State, Nigeria. IAR, ABU Zaria. 72 PP.
FAO. (1995). Guidelines; Land evaluation for rainfall agriculture. Soil Resources Management and Conservation Service, Land and Water Development Division Rome. FAO Soil Bulletin. 52: 237 pp.
FAO. (2006). World Reference Base for Soil Resources 2006. A framework for international classification, correlation and communication. World Soil Resources Reports 103. FAO, Rome. 128 pp.
Gee, G.W. and Bauder, J.W. (1986). Particle size analysis. In Klute, A. (eds). Methods of soil analysis, Part 1: Physical and Mineralogical methods. 2nd Ed. ASA, SSSA. Madison, WI. PP 320-376.
IITA. (1979). Selected methods for soil and plant analysis. International Institute of Tropical Agriculture. Manual series No. 1 pp 70.
IUSS Working Group WRB. (2015). World Reference Base for Soil Resources 2014, update 2015. International soil classification system for naming soils and creating legends for soil maps. World Soil Resources Reports No. 106. FAO, Rome. 203pp.
Naidu, L.G.K., V.Ramamurthy, O.Challa, R.
Hegde and P. Krishnan (2006)
"Manual Soil-Site Suitability Criteria for Major Crops" NBSS
Publication No. 129, NBSS & LUP, Nagpur 118 pp.
Nelson, D. W. and Sommers, L.E. (1982). Organic carbon. In Page, A.L., Miller, R.H. and Keeney, D.R. (eds). Methods of Soil Analysis. Part 2 Agron 9. Madison WI. 538-580.
Ojanuga, A.G. (2006). Agroecological zones of Nigeria Manual. Berding, F. And Chude, V.O. National Special Programme for Food Security (NSPFS) and FAO. 124 pp.
Rhoades, J.D. (1982). Cation exchange capacity. In Page, A.L., Miller, R.H. and Keeney, D.R. (eds). Methods of Soil Analysis. Part 2 Agron 9. Madison WI. 149-157pp.
Soil Survey Staff. (1975). Soil Taxonomy. A basic system of soil classification for making and interpreting soil surveys. Agric. Handbook. No 436. U.S. Gov. Print, Office. Washington, DC. 754 PP.
Soil Survey Staff. (1999). Soil Taxanomy. A basic system of soil classification for making and interpreting soil surveys. Agric. Handbook. No 436. U.S. Gov. Print., Office. Washington, DC. 869 PP.
Soil Survey Staff. (2010). Key to Soil Taxonomy. United States Department of Agriculture. Natural Resources Conservation Service. 11th Edition. 346 pp.
Soil Survey Staff. (2014). Key to Soil Taxonomy. United States Department of Agriculture. Natural Resources Conservation Service. 12th Edition. 372pp.
Sys, I.R, Van Ranst C.E, Debaveye I.R.J. (1993). Land Evaluation. Part III-Crop Requirement. Belgium General Administration for Development Cooperation. Agricultural Publications-No.7.
Thomas, G.W. (1982). Exchangeable cations. In Page, A.L., Miller, R.H. and Keeney, D.R. (eds). Methods of Soil Analysis. Part 2 Agron 9. Madison WI. 159-165.
USBR. (1951). Bureau of Reclamation Manual. Vol. v. Irrigated land use. Part 2: Land classification. Bureau of Reclamation, Dept. Interior, Denver Federal Centre, Denver, Col. 80225, USA.
Appendix A
Soil Unit ABU 1
Pedon 1
General Site Information
Location Ahmadu Bello University Farm, Shika
Date of examination 21/04/2024
Weather prior to Description Sunny
Parent Material Basement Complex
Local Relief Mid slope
Slope 0-2%
Coordinate 11°11´59.9´´, 7°36´05.1´´ & 711.53 m
Soil Erosion/Deposition None
Rock outcrop No bedrock exposed.
Drainage Well Drained
Surface Characteristic None,
Depth to Water table Not encountered
Depth to impenetrable layer Not encountered
land use/ Vegetation Sorghum and cowpea /park land.
Described by A.B. Shobayo and J. Aliyu
Horizon Description
Horizon Depth (cm) Description
Ap 0-35 Light yellowish brown (10YR 6/4) dry and dark yellowish brown 10YR 4/6) moist, silty loam, moderate medium subangular blocky, slightly sticky wet, friable moist, soft dry, fine coarse pores, many fine roots, clear wavy boundary.
Bt 35-80 Yellowish brown (10YR 5/8) dry and Strong brown (7.5YR 4/6) moist, silty clay, Strong medium subangular blocky, sticky wet, firm moist, very hard dry, many coarse pores, few very fine roots, gradual smooth boundary.
Btv1 80-130 Yellow red (5YR 5/8) moist, silty clay, moderate fine angular
blocky, very sticky wet, very firm moist, very hard dry, few coarse pores, few very fine roots, many coarse concretions, prominent coarse mottles, gradual smooth boundary.
Btv2 130-150 Yellow red (5YR 5/8) moist, silty clay, strong fine sub angular
blocky, very sticky wet, very firm moist, very fine coarse
concretions, medium coarse mottles few medium pores, diffuse
wavy boundary.
BCv 150-166 Strong brown (7.5YR 5/6) moist, Gravelly silty clay, massive,
very sticky wet, very firm moist.
Plate 1a: soil profile pit of mapping unit ABU1
Soil Unit ABU 2
Pedon 2
General Site Information
Location Ahmadu Bello University Farm, Shika
Date of examination 21/04/2024
Weather prior to Description Sunny
Parent Material Basement Complex
Local Relief Upper slope
Slope 2-4%
Coordinate 32P 0346968,1239271 & 671.00 m
Soil Erosion/Deposition None
Rock outcrop No bedrock exposed.
Drainage Well Drained
Surface Characteristic None,
Depth to Water table Not encountered
Depth to impenetrable layer 165 cm
land use/ Vegetation Cowpea /park land.
Described by S.L Yau
Horizon Description
Horizon Depth (cm) Description
Ap 0-30 Pink (7.5YR 7/4) dry and strong brown (7.5YR 7/6) moist, loam, moderate fine subangular, blocky, slightly sticky wet, friable moist, slightly hard dry, few fine pores, many medium roots, gradual wavy boundary.
BAt 30-55 Yellowish red (7.5YR 5/6) dry and yellowish red (5YR 4/6) moist clay loam, moderate medium subangular blocky, sticky wet, firm moist, slightly hard dry, few fine pores, common very fine roots, gradual smooth boundary.
Bt 55-90 Reddish yellow (5YR 6/8) dry and yellowish red (5YR 5/6) moist, clay loam, massive, very sticky wet, friable moist, loose dry common fine pores, few very fine roots, gradual wavy boundary.
Btv 90-132 Strong brown (7.5YR 5/8) dry and yellowish red (5YR 5/6) moist, clay loam, strong fine sub angular blocky, very sticky wet, firm moist, soft dry, few very fine pores, few fine roots gradual smooth boundary.
BCv 132-165 Yellowish brown (10YR 5/8) dry and strong brown (7.5YR 5/8) moist, clay massive, very sticky wet, very firm moist, soft
dry, few fine roots

Plate 2a: Profile pit of mapping unit ABU2

Plate 2b: Mapping unit ABU2 showing irrigated land use on gently sloping (2-4%) landscape
Soil Unit ABU 3
General Site Information
Location: ABU Farm (11.19282° N, 7.58959°E)
Date of examination: 22-04-2024.
Weather condition prior to description: Sunny
Elevation: 680m
Taxonomic classification: -
Soil parent material: Undifferentiated gneiss-migmatite and undifferentiated meta-sediment alluvial deposits
Local relief: -
Slope: 0 - 2 %
Soil erosion/description: None
Rock outcrops: None
Drainage: Very poorly drained
Surface characteristics: -
Depth to water table: -
Depth to impenetrable layer: -
Landuse/vegetation: Rice
Human influence: Periodic harrowing/ploughing
Described by: -
Horizon Descriptions
Horizon Depth (cm) Descriptions
Apg 0 – 28 Grayish brown (2.5Y5/2) siltyclay loam, strong brown (7.5YR5/8) few fine distinct mottles, strong medium angular blocky, very sticky (wet), firm (moist), few very fine pores, many fine-medium roots, clear wavy boundary.
ACg 28 – 60 Light yellowish brown (2.5Y6/3) moist, clay loam, strong brown (7.5YR4/6) many medium prominent mottles, moderate medium angular blocky, very sticky (wet), firm (moist), common fine pores, few fine roots, gradual wavy boundary.
2ACg 60 – 97 Grayish brown (2.5Y5/2) moist, silty clay, strong brown (7.5YR4/6) coarse medium distinct mottles, strong fine angular blocky,very sticky (wet), very firm (moist), common fine pores, few very fine roots, diffuse wavy boundary.
2Cg 97 – 130 Grayish brown (2.5Y5/2) moist, clay loam strong brown (7.5YR4/6) common medium distinct mottles, strong fine angular blocky, very sticky (wet), very firm (moist), few fine pores, coarse Fe-Mn concretions, gradual wavy boundary.
3Cg 130 – 180 Gray (2.5Y5/1) moist, clay, brownish yellow (10YR6/8) common medium prominent mottles, strong fine angular blocky, very sticky (wet), very firm (moist), few fine pores

Plate 3a: profile pit of mapping unit ABU3

Plate 3b: Mapping unit ABU2 showing irrigated land use (cabbage) on level to nearly level( 0-2%) landscape
Soil Unit ABU 4
Pedon 4
General Site Information
Location Ahmadu Bello University Farm, Shika
Date of examination 21/04/2024
Weather prior to Description Sunny
Parent Material Alluvial/Basement Complex
Local Relief Upper slope
Slope 2-4%
Coordinate 11°12´05.4´´, 7°36´56.1´´ 694.78 m
Soil Erosion/Deposition None
Rock outcrop No bedrock exposed.
Drainage Very poorly drained
Surface Characteristic None,
Depth to Water table 85 cm
Depth to impenetrable layer Not encountered
land use/ Vegetation Rice /park land.
Described by A.B. Shobayo and J. Aliyu
Horizon Description
Horizon Depth (cm) Description
Apg 0-14 Very dark greyish brown (10YR 3/2) moist, strong brown (10YR 5/8) few fine faint mottles, silt loam, moderate medium subangular, blocky, slightly sticky wet, friable moist, soft dry, few fine roots, clear wavy boundary.
ABg 14-30 Very dark grey (10YR 3/1) moist, strong brown (7.5YR 5/8) few fine faint mottles silty loam, moderate medium subangular blocky, slightly sticky wet, friable moist, few fine roots, abrupt smooth boundary.
Btgv1 30-60 Grey (2.5Y 5/4) moist, strong brown (7.5YR 5/8) common to many medium mottles, clay loam, massive, very sticky wet, very firm moist, many prominent concretions, diffuse smooth boundary.
Btgv2 60-85 Grey (2.5Y 6/1) moist, yellowish brown (10YR 5/8) common fine distinct mottles, silty loam, massive, very sticky wet, firm moist, many prominent concretions, water table encountered at 85 cm.

Plate 4: profile pit of mapping unit ABU4
Soil Unit ABU 5
Pedon 5
General Site Information
Location Ahmadu Bello University Farm, Shika
Date of examination 21/04/2024
Weather prior to Description Sunny
Parent Material Basement Complex
Local Relief Upper slope
Slope 2-4%
Coordinate 11°12´08.5´´, 7°35´57.7´´ 710.84 m
Soil Erosion/Deposition None
Rock outcrop 23 cm
Drainage Very well drained
Surface Characteristic None,
Depth to Water table Not encountered
Depth to impenetrable layer Encountered at 23cm
land use/ Vegetation Soybeans /park land.
Described by A.B. Shobayo and J. Aliyu
Horizon Description
Horizon Depth (cm) Description
Cv 12-23 Light yellowish brown (10YR 6/4) dry and light greyish brown (10YR 4/2) moist, silty loam, massive, sticky wet, very firm moist, hard dry.

Plate 5a: profile pit of mapping unit ABU5

Plate 5b: Soil Mapping Unit ABU 5 showing very shallow gravelly ironstones and boulder on surface on gently and undulating slope (2 – 4 %) landscape.

Plate 6: Soil Mapping Unit ABU 6 showing gully degraded land with crusted surfaces and shrubs.
APPENDIX B1
|
Physiographic and Morphological Properties of ABU Farm Shika |
|
||||||||
|
Auger points |
Co-ordinate |
Topography/slope |
TC |
Drainage |
Effective depth |
Erosion |
Land Use |
||
|
Eastings |
Northings |
Position/Gradient (%) |
|
|
|
|
|
||
|
ABU1 |
346665.2555 |
1236687.138 |
US/Nearly level (0-2) |
L |
Well drained |
Very shallow |
None |
cowpea |
|
|
ABU2 |
346940.2555 |
1236687.138 |
CR/Nearly level (0-2) |
SiL |
Well drained |
Deep to very deep |
None |
cowpea |
|
|
ABU3 |
346390.2555 |
1236962.138 |
MS/Nearly level (0-2) |
SiL |
Well drained |
Deep to very deep |
None |
Sorghum |
|
|
ABU4 |
346665.2555 |
1236962.138 |
MS/Nearly level (0-2) |
L |
Well drained |
Deep to very deep |
None |
Upland rice |
|
|
ABU5 |
346940.2555 |
1236962.138 |
CR/Nearly level (0-2) |
L |
Well drained |
Very shallow |
Slight/sheet |
Upland rice |
|
|
ABU6 |
345840.2555 |
1237237.138 |
US/Nearly level (0-2) |
SiCL |
Excessively drained |
Very shallow/plinthite |
Slight/sheet |
Upland rice |
|
|
ABU7 |
346115.2555 |
1237237.138 |
US/Nearly level (0-2) |
SiC |
Excessively drained |
Deep to very deep |
None |
Sorghum |
|
|
ABU8 |
346390.2555 |
1237237.138 |
US/Nearly level (0-2) |
CL |
Well drained |
Deep to very deep |
None |
Hibiscus |
|
|
ABU9 |
346665.2555 |
1237237.138 |
US/Nearly level (0-2) |
SiL |
Well drained |
Deep to very deep |
None |
soybean |
|
|
ABU10 |
346940.2555 |
1237237.138 |
US/Nearly level (0-2) |
SiCL |
Well drained |
Shallow |
None |
soybean |
|
|
ABU11 |
347215.2555 |
1237237.138 |
US/Nearly level (0-2) |
C |
Excessively drained |
Deep to very deep |
None |
soybean |
|
|
ABU12 |
345840.2555 |
1237512.138 |
US/Nearly level (0-2) |
SiL |
Well drained |
Deep to very deep |
None |
Upland rice |
|
|
ABU13 |
346115.2555 |
1237512.138 |
LS/Nearly level (0-2) |
SiL |
Moderately drained |
Deep to very deep |
None |
rice |
|
|
ABU14 |
346390.2555 |
1237512.138 |
LS/Nearly level (0-2) |
SiCL |
Moderately drained |
Deep to very deep |
None |
rice |
|
|
ABU15 |
346665.2555 |
1237512.138 |
US/Nearly level (0-2) |
SiL |
Well drained |
Deep to very deep |
None |
|
|
|
ABU16 |
346940.2555 |
1237512.138 |
US/Nearly level (0-2) |
SiL |
Well drained |
Deep to very deep |
None |
Millet and Sorghum |
|
|
ABU17 |
347215.2555 |
1237512.138 |
US/Nearly level (0-2) |
CL |
Well drained |
Deep to very deep |
None |
Rice and Sorghum |
|
|
ABU18 |
346115.2555 |
1237787.138 |
MS/Nearly level (0-2) |
SiL |
Well drained |
Deep to very deep |
None |
Cowpea |
|
|
Key: TC=Textural Class, US=upper slope, CR=Crest, MS=middle slope, LS=lower slope, FP=flood plain, VB=valley Bottom, L=loam, SiL=silty loam, SiCL=silty clay loam, SiL=Silty loam, CL=clay loam, C=clay, SiC + silty clay, NS=not sampled. |
|
||||||||
|
Appendix B1 cont.: Physiographic and Morphological Properties of ABU Farm Shika |
|||||||||
|
Auger points |
Co-ordinate |
Topography/slope |
TC |
Drainage |
Effective depth |
Erosion |
Land Use |
|
|
|
Eastings |
Northings |
Position/Gradient (%) |
|
|
|
|
|
|
|
|
ABU19 |
346390.256 |
1237787.14 |
US/Nearly level (0-2) |
SiC |
Well drained |
Deep to very deep |
None |
Soybean and Sorghum |
|
|
ABU20 |
346665.256 |
1237787.14 |
US/Nearly level (0-2) |
CL |
Well drained |
Shallow/ scattered gravels |
None |
soybean |
|
|
ABU21` |
346940.256 |
1237787.14 |
US/Nearly level (0-2) |
SiL |
Well drained |
Deep to very deep |
None |
Soybean |
|
|
ABU22 |
347215.256 |
1237787.14 |
MS/Nearly level (0-2) |
CL |
Well drained |
Deep to very deep |
None |
Soybean |
|
|
ABU23 |
347490.256 |
1237787.14 |
US/Nearly level (0-2) |
CL |
Well drained |
Deep to very deep |
None |
Cowpea |
|
|
ABU24 |
346115.256 |
1238062.14 |
US/Nearly level (0-2) |
CL |
Well drained |
Moderately deep with Very few gravels |
None |
Sorghum |
|
|
ABU25 |
346390.256 |
1238062.14 |
US/undulating (2-4) |
L |
Well drained |
Shallow |
None |
Upland rice |
|
|
ABU26 |
346665.256 |
1238062.14 |
US/undulating (2-4) |
SiL |
Well drained |
Shallow |
None |
Upland rice |
|
|
ABU27 |
346940.256 |
1238062.14 |
LS/undulating (2-4) |
L |
Poorly drained |
Deep to very deep |
None |
Rice |
|
|
ABU28 |
347215.256 |
1238062.14 |
MS/Nearly level (0-2) |
L |
Well drained |
Deep to very deep |
None |
Vegetable |
|
|
ABU29 |
347490.256 |
1238062.14 |
US/Nearly level (0-2) |
SiCL |
Well drained |
Deep to very deep |
None |
soybean |
|
|
ABU30 |
346390.256 |
1238337.14 |
US/Nearly level (0-2) |
SiL |
Well drained |
Deep to very deep |
None |
fallow |
|
|
ABU31 |
346665.256 |
1238337.14 |
US/Nearly level (0-2) |
NS |
Moderately drained |
Petroplinthite |
Slight/sheet |
Bare surface |
|
|
ABU32 |
346940.256 |
1238337.14 |
MS/undulating (2-4) |
SiC |
Well drained |
Deep to very deep |
None |
Soybean |
|
|
ABU33 |
347215.256 |
1238337.14 |
MS/undulating (2-4) |
SiL |
Well drained |
Deep to very deep |
None |
Soybean |
|
|
ABU34 |
347490.256 |
1238337.14 |
MS/Nearly level (0-2) |
SiL |
Well drained |
Deep to very deep |
None |
Tomato |
|
|
ABU35 |
346390.256 |
1238612.14 |
US/undulating (2-4) |
SiC |
Well drained |
Deep, Gravelly |
None |
soybean |
|
|
ABU36 |
346665.256 |
1238612.14 |
MS/Nearly level (0-2) |
L |
Well drained |
Deep to very deep |
None |
Carrot |
|
|
Key: TC=Textural Class, US=upper slope, CR=Crest, MS=middle slope, LS=lower slope, FP=flood plain, VB=valley Bottom, L=loam, SiL=silty loam, SiCL=silty clay loam, SiL=Silty loam, CL=clay loam, C=clay, SiC + silty clay, NS=not sampled. |
|||||||||
APPENDIX B2
|
Physical and chemical Properties of Top 0 – 30 cm Auger Points |
|||||||||||||||
|
Serial No. |
Auger Point |
Coordinate points |
clay |
Sand |
Silt |
Texture |
pH H2O |
pH CaCl2 |
ECe |
OC |
TN |
AP |
|
||
|
|
|
x |
y |
g/kg |
|
|
|
dS/m |
g/kg |
mg/kg |
|||||
|
1 |
ABU1 |
346665.256 |
1236687.14 |
140 |
460 |
400 |
LOAM |
6.88 |
5.03 |
0.055 |
5.93 |
3.08 |
14.7 |
|
|
|
2 |
ABU2 |
346940.256 |
1236687.14 |
260 |
500 |
240 |
SILTY LOAM |
6.65 |
4.86 |
0.04 |
4. 608 |
5.04 |
9.8 |
|
|
|
3 |
ABU3 |
346390.256 |
1236962.14 |
180 |
640 |
180 |
SILTY LOAM |
6.16 |
4.66 |
0.05 |
4.61 |
5.88 |
9.31 |
|
|
|
4 |
ABU4 |
346665.256 |
1236962.14 |
240 |
480 |
280 |
LOAM |
6.07 |
4.60 |
0.045 |
3.07 |
5.04 |
11.76 |
|
|
|
5 |
ABU5 |
346940.256 |
1236962.14 |
240 |
420 |
340 |
LOAM |
5.99 |
4.74 |
0.05 |
4.39 |
0.42 |
13.72 |
|
|
|
6 |
ABU6 |
345840.256 |
1237237.14 |
280 |
700 |
20 |
SILTY CLAY LOAM |
6.29 |
4.12 |
0.05 |
6.80 |
0.28 |
12.25 |
|
|
|
7 |
ABU7 |
346115.256 |
1237237.14 |
500 |
460 |
40 |
SILTY CLAY |
6.30 |
4.92 |
0.035 |
5.49 |
0.476 |
11.27 |
|
|
|
8 |
ABU8 |
346390.256 |
1237237.14 |
300 |
480 |
220 |
CLAY LOAM |
6.26 |
5.04 |
0.04 |
2.41 |
0.364 |
10.29 |
|
|
|
9 |
ABU9 |
346665.256 |
1237237.14 |
240 |
620 |
140 |
SILTY LOAM |
6.07 |
4.49 |
0.05 |
8.34 |
0.42 |
9.31 |
|
|
|
10 |
ABU10 |
346940.256 |
1237237.14 |
400 |
480 |
120 |
SILTY CLAY LOAM |
5.98 |
4.64 |
0.04 |
3.51 |
0.364 |
9.8 |
|
|
|
11 |
ABU11 |
347215.256 |
1237237.14 |
440 |
400 |
160 |
CLAY |
5.95 |
4.73 |
0.05 |
3.73 |
0.588 |
10.29 |
|
|
|
12 |
ABU12 |
345840.256 |
1237512.14 |
180 |
740 |
80 |
SILTY LOAM |
5.87 |
4.57 |
0.011 |
3.07 |
0.476 |
20.58 |
|
|
|
13 |
ABU13 |
346115.256 |
1237512.14 |
260 |
640 |
100 |
SILTY LOAM |
6.44 |
5.10 |
0.04 |
5.93 |
0.812 |
12.74 |
|
|
|
14 |
ABU14 |
346390.256 |
1237512.14 |
280 |
560 |
160 |
SILTY CLAY LOAM |
6.49 |
5.10 |
0.04 |
15.36 |
0.784 |
13.23 |
|
|
|
15 |
ABU15 |
346665.256 |
1237512.14 |
240 |
580 |
180 |
SILTY LOAM |
6.42 |
5.12 |
0.055 |
8.12 |
0.784 |
12.74 |
|
|
|
16 |
ABU16 |
346940.256 |
1237512.14 |
200 |
740 |
60 |
SILTY LOAM |
5.89 |
4.65 |
0.011 |
5.71 |
0.728 |
19.6 |
|
|
|
17 |
ABU17 |
347215.256 |
1237512.14 |
320 |
460 |
220 |
CLAY LOAM |
5.43 |
4.89 |
0.014 |
7.46 |
0.672 |
19.11 |
|
|
|
18 |
ABU18 |
346115.256 |
1237787.14 |
260 |
640 |
100 |
SILTY LOAM |
6.10 |
4.47 |
0.014 |
14.26 |
0.252 |
15.19 |
|
|
|
19 |
ABU19 |
346390.256 |
1237787.14 |
420 |
420 |
160 |
SILTY CLAY |
6.16 |
4.18 |
0.013 |
2.20 |
0.42 |
14.21 |
|
|
|
20 |
ABU20 |
346665.256 |
1237787.14 |
360 |
400 |
240 |
CLAY LOAM |
6.26 |
5.22 |
0.014 |
5.49 |
0.336 |
11.76 |
|
|
|
21 |
ABU21` |
346940.256 |
1237787.14 |
260 |
660 |
80 |
SILTY LOAM |
6.36 |
5.01 |
0.014 |
5.93 |
0.336 |
14.7 |
|
|
|
22 |
ABU22 |
347215.256 |
1237787.14 |
380 |
380 |
240 |
CLAY LOAM |
6.29 |
4.75 |
0.012 |
1.10 |
0.42 |
13.23 |
|
|
|
23 |
ABU23 |
347490.256 |
1237787.14 |
340 |
320 |
340 |
CLAY LOAM |
6.08 |
4.96 |
0.014 |
5.05 |
0.532 |
15.68 |
|
|
|
24 |
ABU24 |
346115.256 |
1238062.14 |
280 |
380 |
340 |
CLAY LOAM |
6.34 |
4.68 |
0.012 |
5.05 |
0.42 |
21.56 |
|
|
|
25 |
ABU25 |
346390.256 |
1238062.14 |
160 |
460 |
380 |
LOAM |
5.99 |
5.33 |
0.05 |
6.15 |
0.448 |
17.15 |
|
|
|
Appendix B2 cont.: Physical and chemical Properties of Top 0 – 30 cm Auger Points |
||||||||||||||
|
Serial No. |
Auger Point |
Coordinate points |
clay |
Sand |
Silt |
Texture |
pH H2O |
pH CaCl2 |
ECe |
OC |
TN |
AP |
|
|
|
|
|
x |
y |
g/kg |
|
|
|
dS/m |
g/kg |
mg/kg |
|
|||
|
26 |
ABU26 |
346665.256 |
1238062.14 |
160 |
520 |
320 |
SILTY LOAM |
6.04 |
7.681 |
0.588 |
11.41 |
0.84 |
24.01 |
|
|
27 |
ABU27 |
346940.256 |
1238062.14 |
260 |
400 |
340 |
LOAM |
5.78 |
8.997 |
0.7 |
7.681 |
0.588 |
20.58 |
|
|
28 |
ABU28 |
347215.256 |
1238062.14 |
220 |
480 |
300 |
LOAM |
5.89 |
9.217 |
0.84 |
8.997 |
0.7 |
28.42 |
|
|
29 |
ABU29 |
347490.256 |
1238062.14 |
360 |
520 |
120 |
SILTY CLAY LOAM |
5.43 |
9.875 |
0.84 |
9.217 |
0.84 |
19.6 |
|
|
30 |
ABU30 |
346390.256 |
1238337.14 |
180 |
540 |
280 |
SILTY LOAM |
5.75 |
8.235 |
0.448 |
9.875 |
0.84 |
29.89 |
|
|
31 |
ABU32 |
346940.256 |
1238337.14 |
480 |
500 |
20 |
SILTY CLAY |
6.02 |
10.151 |
0.28 |
8.235 |
0.448 |
16.17 |
|
|
32 |
ABU33 |
347215.256 |
1238337.14 |
160 |
560 |
280 |
SILTY LOAM |
5.93 |
9.576 |
0.14 |
10.15 |
0.28 |
33.32 |
|
|
33 |
ABU34 |
347490.256 |
1238337.14 |
140 |
760 |
100 |
SILTY LOAM |
6.07 |
9.959 |
0.56 |
9.576 |
0.14 |
7.84 |
|
|
34 |
ABU35 |
346390.256 |
1238612.14 |
460 |
520 |
200 |
SILTY CLAY |
5.93 |
8.618 |
0.532 |
9.959 |
0.56 |
6.86 |
|
|
35 |
ABU36 |
346665.256 |
1238612.14 |
200 |
400 |
400 |
LOAM |
5.57 |
13.981 |
0.868 |
8.618 |
0.532 |
10.29 |
|
|
36 |
ABU37 |
346940.256 |
1238612.14 |
260 |
700 |
40 |
SILTY LOAM |
6.54 |
11.3 |
0.784 |
13.98 |
0.868 |
33.81 |
|
|
37 |
ABU38 |
347215.256 |
1238612.14 |
220 |
640 |
140 |
SILTY LOAM |
6.59 |
9.193 |
0.336 |
11.3 |
0.784 |
7.84 |
|
|
38 |
ABU39 |
347490.256 |
1238612.14 |
320 |
580 |
100 |
SILTY CLAY LOAM |
5.79 |
10.151 |
0.644 |
9.193 |
0.336 |
8.33 |
|
|
39 |
ABU41 |
346665.256 |
1238887.14 |
120 |
580 |
300 |
SILTY LOAM |
5.68 |
10.342 |
0.28 |
10.15 |
0.644 |
14.21 |
|
|
40 |
ABU42 |
346940.256 |
1238887.14 |
320 |
520 |
160 |
SILTY CLAY LOAM |
6.91 |
13.215 |
0.364 |
10.34 |
0.28 |
13.72 |
|
|
41 |
ABU45 |
347765.256 |
1238887.14 |
280 |
640 |
80 |
SILTY CLAY LOAM |
5.71 |
16.471 |
1.708 |
13.21 |
0.364 |
13.23 |
|
|
42 |
ABU46 |
346665.256 |
1239162.14 |
300 |
680 |
20 |
SILTY CLAY LOAM |
5.87 |
10.917 |
0.56 |
16.47 |
1.708 |
9.8 |
|
|
43 |
ABU47 |
346940.256 |
1239162.14 |
280 |
600 |
120 |
SILTY CLAY LOAM |
5.84 |
14.172 |
0.868 |
10.91 |
0.56 |
11.27 |
|
|
44 |
ABU48 |
347215.256 |
1239162.14 |
280 |
580 |
140 |
SILTY CLAY LOAM |
6.35 |
13.981 |
0.784 |
14.17 |
0.868 |
81.83 |
|
|
45 |
ABU49 |
347490.256 |
1239162.14 |
240 |
720 |
40 |
SILTY LOAM |
6.35 |
13.215 |
0.56 |
13.98 |
0.784 |
12.25 |
|
|
46 |
ABU50 |
347765.256 |
1239162.14 |
380 |
600 |
20 |
SILTY CLAY LOAM |
5.88 |
8.618 |
0.448 |
13.21 |
0.56 |
10.78 |
|
|
47 |
ABU51 |
348040.256 |
1239162.14 |
180 |
660 |
160 |
SILTY LOAM |
6.45 |
7.086 |
0.448 |
8.618 |
0.448 |
12.25 |
|
|
48 |
ABU52 |
346940.256 |
1239437.14 |
160 |
760 |
80 |
SILTY LOAM |
6.52 |
9.193 |
0.448 |
7.086 |
0.448 |
18.62 |
|
|
49 |
ABU53 |
347215.256 |
1239437.14 |
180 |
700 |
120 |
SILTY LOAM |
6.25 |
7.278 |
0.644 |
9.193 |
0.448 |
11.27 |
|
|
50 |
ABU54 |
347490.256 |
1239437.14 |
200 |
660 |
140 |
SILTY LOAM |
5.93 |
10.151 |
0.364 |
7.278 |
0.644 |
12.25 |
|
|
51 |
ABU55 |
346940.256 |
1239712.14 |
120 |
700 |
180 |
SILTY LOAM |
6.19 |
6.129 |
0.364 |
10.15 |
0.364 |
12.25 |
|
|
52 |
ABU56 |
347215.256 |
1239712.14 |
140 |
600 |
260 |
SILTY LOAM |
6.17 |
11.411 |
0.84 |
6.129 |
0.364 |
12.74 |
|
APPENDIX B3
|
Chemical Properties of Top 0 – 30 cm Auger Points |
|||||||||||||||||||||||||||||||||
|
Serial No. |
Auger Point |
Coordinate points |
Ca |
Mg |
K |
Na |
TEB |
CEC |
H+Al |
ECEC |
PBS |
ESP |
SAR |
HCO3 |
Cl |
Fe |
Mn |
Cu |
Zn |
|
|||||||||||||
|
|
|
x |
y |
|
cmol (+)/kg |
% |
|
|
|
|
|
|
|
|
|||||||||||||||||||
|
1 |
ABU1 |
346665.256 |
1236687.14 |
5.00 |
1.50 |
0.12 |
0.16 |
6.78 |
8.28 |
0.60 |
7.38 |
81.88 |
1.93 |
0.09 |
9.40 |
0.90 |
188.30 |
43.72 |
0.40 |
4.80 |
|
||||||||||||
|
2 |
ABU2 |
346940.256 |
1236687.14 |
4.60 |
1.38 |
0.37 |
0.35 |
6.70 |
8.20 |
0.60 |
7.30 |
81.71 |
4.27 |
0.20 |
4.80 |
1.00 |
153.84 |
49.52 |
0.46 |
2.38 |
|
||||||||||||
|
3 |
ABU3 |
346390.256 |
1236962.14 |
4.40 |
1.20 |
0.18 |
0.19 |
5.97 |
7.47 |
0.60 |
6.57 |
79.92 |
2.54 |
0.11 |
2.80 |
0.70 |
370.92 |
109.52 |
0.14 |
1.60 |
|
||||||||||||
|
4 |
ABU4 |
346665.256 |
1236962.14 |
4.60 |
1.24 |
0.19 |
0.19 |
6.22 |
7.72 |
0.60 |
6.82 |
80.57 |
2.46 |
0.11 |
6.40 |
0.60 |
145.90 |
91.72 |
0.04 |
2.38 |
|
||||||||||||
|
5 |
ABU5 |
346940.256 |
1236962.14 |
2.40 |
0.65 |
0.11 |
0.17 |
3.33 |
5.03 |
0.80 |
4.13 |
66.20 |
3.38 |
0.14 |
3.40 |
0.50 |
114.26 |
26.22 |
0.50 |
2.08 |
|
||||||||||||
|
6 |
ABU6 |
345840.256 |
1237237.14 |
5.00 |
1.35 |
0.21 |
0.25 |
6.81 |
8.31 |
0.60 |
7.41 |
81.95 |
3.01 |
0.14 |
2.00 |
0.40 |
129.58 |
38.16 |
0.66 |
1.94 |
|
||||||||||||
|
7 |
ABU7 |
346115.256 |
1237237.14 |
5.00 |
1.60 |
0.21 |
0.18 |
6.99 |
8.29 |
0.40 |
7.39 |
84.32 |
2.17 |
0.10 |
3.60 |
0.70 |
88.52 |
62.18 |
1.40 |
0.96 |
|
||||||||||||
|
8 |
ABU8 |
346390.256 |
1237237.14 |
5.00 |
1.49 |
0.33 |
0.37 |
7.19 |
8.29 |
0.20 |
7.39 |
86.73 |
4.46 |
0.21 |
4.20 |
0.60 |
170.62 |
94.38 |
1.98 |
1.02 |
|
||||||||||||
|
9 |
ABU9 |
346665.256 |
1237237.14 |
3.40 |
1.03 |
0.17 |
0.19 |
4.79 |
6.09 |
0.40 |
5.19 |
78.65 |
3.12 |
0.13 |
1.80 |
0.50 |
187.06 |
79.16 |
2.24 |
1.98 |
|
||||||||||||
|
10 |
ABU10 |
346940.256 |
1237237.14 |
3.00 |
0.92 |
0.12 |
0.17 |
4.21 |
5.91 |
0.80 |
5.01 |
71.24 |
2.88 |
0.12 |
4.00 |
0.90 |
107.44 |
23.72 |
2.86 |
2.16 |
|
||||||||||||
|
11 |
ABU11 |
347215.256 |
1237237.14 |
4.60 |
1.40 |
0.32 |
0.29 |
6.61 |
8.51 |
1.00 |
7.61 |
77.67 |
3.41 |
0.17 |
2.40 |
0.50 |
113.78 |
62.28 |
3.16 |
2.06 |
|
||||||||||||
|
12 |
ABU12 |
345840.256 |
1237512.14 |
4.20 |
1.26 |
0.17 |
0.16 |
5.79 |
7.29 |
0.60 |
6.39 |
79.42 |
2.19 |
0.10 |
2.00 |
0.60 |
348.52 |
86.56 |
3.56 |
2.02 |
|
||||||||||||
|
13 |
ABU13 |
346115.256 |
1237512.14 |
5.40 |
1.62 |
0.21 |
0.29 |
7.52 |
8.82 |
0.40 |
7.92 |
85.26 |
3.29 |
0.15 |
1.40 |
0.70 |
526.42 |
153.20 |
4.82 |
8.30 |
|
||||||||||||
|
14 |
ABU14 |
346390.256 |
1237512.14 |
3.60 |
1.08 |
0.34 |
0.34 |
5.36 |
6.66 |
0.40 |
5.76 |
80.48 |
5.11 |
0.22 |
2.00 |
0.80 |
421.48 |
140.16 |
3.78 |
1.90 |
|
||||||||||||
|
15 |
ABU15 |
346665.256 |
1237512.14 |
1.40 |
0.42 |
0.13 |
0.17 |
2.12 |
3.82 |
0.80 |
2.92 |
55.50 |
4.45 |
0.18 |
1.80 |
0.60 |
228.64 |
68.64 |
4.16 |
1.34 |
|
||||||||||||
|
16 |
ABU16 |
346940.256 |
1237512.14 |
3.00 |
0.90 |
0.18 |
0.17 |
4.25 |
5.35 |
0.20 |
4.45 |
79.44 |
3.18 |
0.12 |
1.80 |
0.70 |
196.06 |
119.32 |
4.68 |
1.36 |
|
||||||||||||
|
17 |
ABU17 |
347215.256 |
1237512.14 |
3.80 |
1.15 |
0.34 |
0.28 |
5.57 |
6.67 |
0.20 |
5.77 |
83.51 |
4.20 |
0.18 |
1.80 |
0.60 |
308.56 |
98.44 |
4.96 |
1.92 |
|
||||||||||||
|
18 |
ABU18 |
346115.256 |
1237787.14 |
7.40 |
2.21 |
0.14 |
0.22 |
9.97 |
11.47 |
0.60 |
10.57 |
86.92 |
1.92 |
0.10 |
1.20 |
0.60 |
230.86 |
55.20 |
5.44 |
4.64 |
|
||||||||||||
|
19 |
ABU19 |
346390.256 |
1237787.14 |
5.40 |
1.62 |
0.11 |
0.17 |
7.30 |
8.80 |
0.60 |
7.90 |
82.95 |
1.93 |
0.09 |
2.00 |
0.60 |
196.64 |
49.38 |
5.14 |
1.52 |
|
||||||||||||
|
20 |
ABU20 |
346665.256 |
1237787.14 |
3.00 |
0.81 |
0.06 |
0.07 |
3.94 |
5.64 |
0.80 |
4.74 |
69.86 |
1.24 |
0.05 |
1.80 |
0.60 |
166.96 |
18.08 |
5.64 |
1.84 |
|
||||||||||||
|
21 |
ABU21` |
346940.256 |
1237787.14 |
4.60 |
1.24 |
0.11 |
0.16 |
6.11 |
7.81 |
0.80 |
6.91 |
78.23 |
2.05 |
0.09 |
1.00 |
0.80 |
221.96 |
43.96 |
5.96 |
1.96 |
|
||||||||||||
|
22 |
ABU22 |
347215.256 |
1237787.14 |
4.60 |
1.38 |
0.19 |
0.34 |
6.51 |
8.21 |
0.80 |
7.31 |
79.29 |
4.14 |
0.20 |
2.20 |
0.50 |
220.14 |
82.28 |
6.28 |
2.12 |
|
||||||||||||
|
23 |
ABU23 |
347490.256 |
1237787.14 |
5.40 |
1.60 |
0.21 |
0.23 |
7.44 |
8.94 |
0.60 |
8.04 |
83.22 |
2.57 |
0.12 |
2.80 |
0.90 |
242.70 |
17.54 |
6.74 |
2.40 |
|
||||||||||||
|
24 |
ABU24 |
346115.256 |
1238062.14 |
4.00 |
1.20 |
0.10 |
0.17 |
5.47 |
7.17 |
0.80 |
6.27 |
76.29 |
2.37 |
0.11 |
1.60 |
1.00 |
359.18 |
23.38 |
6.94 |
2.36 |
|
||||||||||||
|
25 |
ABU25 |
346390.256 |
1238062.14 |
5.80 |
1.74 |
0.13 |
0.21 |
7.88 |
9.58 |
0.80 |
8.68 |
82.25 |
2.19 |
0.11 |
1.20 |
0.50 |
340.44 |
51.30 |
7.48 |
2.48 |
|
||||||||||||
|
Appendix B3 cont.: chemical Properties of Top 0 – 30 cm Auger Points |
|||||||||||||||||||||||||||||
|
Serial No. |
Auger Point |
Coordinate points |
Ca |
Mg |
K |
Na |
TEB |
CEC |
H+Al |
ECEC |
PBS |
ESP |
SAR |
HCO3 |
Cl |
Fe |
Mn |
Cu |
Zn |
|
|||||||||
|
|
|
x |
y |
cmol(+)/kg |
% |
|
|
|
|
|
|
|
|||||||||||||||||
|
26 |
ABU26 |
346665.256 |
1238062.14 |
3.00 |
0.81 |
0.41 |
0.26 |
4.48 |
5.58 |
0.20 |
4.68 |
80.29 |
4.66 |
0.19 |
1.20 |
0.60 |
437.20 |
120.68 |
7.98 |
3.76 |
|
||||||||
|
27 |
ABU27 |
346940.256 |
1238062.14 |
7.60 |
2.28 |
0.11 |
0.22 |
10.21 |
12.11 |
1.00 |
11.21 |
84.31 |
1.82 |
0.10 |
1.40 |
0.80 |
873.72 |
43.64 |
8.08 |
3.30 |
|
||||||||
|
28 |
ABU28 |
347215.256 |
1238062.14 |
5.80 |
1.70 |
0.51 |
0.40 |
8.41 |
9.51 |
0.20 |
8.61 |
88.43 |
4.21 |
0.21 |
1.80 |
0.60 |
285.64 |
40.30 |
9.16 |
5.30 |
|
||||||||
|
29 |
ABU29 |
347490.256 |
1238062.14 |
4.00 |
1.20 |
0.16 |
0.20 |
5.56 |
8.66 |
2.20 |
7.76 |
64.20 |
2.31 |
0.12 |
1.60 |
1.00 |
303.28 |
104.30 |
8.62 |
3.12 |
|
||||||||
|
30 |
ABU30 |
346390.256 |
1238337.14 |
8.00 |
2.40 |
0.25 |
0.24 |
10.89 |
12.59 |
0.80 |
11.69 |
86.50 |
1.91 |
0.11 |
2.40 |
0.70 |
304.46 |
53.68 |
9.00 |
3.30 |
|
||||||||
|
31 |
ABU32 |
346940.256 |
1238337.14 |
3.60 |
1.08 |
0.41 |
0.38 |
5.47 |
6.57 |
0.20 |
5.67 |
83.26 |
5.78 |
0.25 |
1.80 |
0.70 |
246.26 |
103.12 |
9.48 |
5.46 |
|
||||||||
|
32 |
ABU33 |
347215.256 |
1238337.14 |
3.20 |
0.96 |
0.24 |
0.22 |
4.62 |
5.92 |
0.40 |
5.02 |
78.04 |
3.72 |
0.15 |
2.00 |
0.70 |
601.94 |
19.14 |
9.74 |
2.70 |
|
||||||||
|
33 |
ABU34 |
347490.256 |
1238337.14 |
4.60 |
1.20 |
0.18 |
0.28 |
6.26 |
7.76 |
0.60 |
6.86 |
80.67 |
3.61 |
0.16 |
2.60 |
0.70 |
514.68 |
86.24 |
9.76 |
2.98 |
|
||||||||
|
34 |
ABU35 |
346390.256 |
1238612.14 |
3.60 |
2.40 |
0.13 |
0.11 |
6.24 |
7.74 |
0.60 |
6.84 |
80.62 |
1.42 |
0.06 |
1.20 |
0.60 |
256.36 |
58.00 |
10.76 |
5.08 |
|
||||||||
|
35 |
ABU36 |
346665.256 |
1238612.14 |
7.60 |
1.08 |
0.12 |
0.17 |
8.97 |
10.07 |
0.20 |
9.17 |
89.08 |
1.69 |
0.08 |
1.80 |
0.60 |
567.64 |
38.56 |
10.12 |
3.24 |
|
||||||||
|
36 |
ABU37 |
346940.256 |
1238612.14 |
5.20 |
0.96 |
1.13 |
0.63 |
7.92 |
9.22 |
0.40 |
8.32 |
85.90 |
6.83 |
0.36 |
1.20 |
0.80 |
315.40 |
141.34 |
10.52 |
4.38 |
|
||||||||
|
37 |
ABU38 |
347215.256 |
1238612.14 |
3.00 |
1.38 |
0.27 |
0.21 |
4.86 |
6.36 |
0.60 |
5.46 |
76.42 |
3.30 |
0.14 |
1.80 |
0.60 |
464.92 |
57.84 |
11.26 |
4.64 |
|
||||||||
|
38 |
ABU39 |
347490.256 |
1238612.14 |
5.20 |
1.60 |
0.09 |
0.15 |
7.04 |
8.54 |
0.60 |
7.64 |
82.44 |
1.76 |
0.08 |
2.80 |
0.60 |
813.68 |
34.86 |
11.62 |
3.86 |
|
||||||||
|
39 |
ABU41 |
346665.256 |
1238887.14 |
5.40 |
2.28 |
0.42 |
0.28 |
8.38 |
10.08 |
0.80 |
9.18 |
83.13 |
2.78 |
0.14 |
2.80 |
0.50 |
525.62 |
86.88 |
11.58 |
5.36 |
|
||||||||
|
40 |
ABU42 |
346940.256 |
1238887.14 |
4.40 |
1.56 |
0.28 |
0.28 |
6.52 |
8.22 |
0.80 |
7.32 |
79.32 |
3.41 |
0.16 |
1.80 |
0.70 |
468.42 |
130.44 |
12.08 |
4.88 |
|
||||||||
|
41 |
ABU45 |
347765.256 |
1238887.14 |
6.60 |
0.90 |
0.11 |
0.24 |
7.85 |
9.55 |
0.80 |
8.65 |
82.20 |
2.51 |
0.12 |
1.40 |
0.50 |
421.32 |
109.32 |
12.34 |
4.86 |
|
||||||||
|
42 |
ABU46 |
346665.256 |
1239162.14 |
4.60 |
1.56 |
0.30 |
0.87 |
7.33 |
8.63 |
0.40 |
7.73 |
84.94 |
10.08 |
0.50 |
5.40 |
0.90 |
1007.38 |
219.46 |
12.42 |
7.02 |
|
||||||||
|
43 |
ABU47 |
346940.256 |
1239162.14 |
6.00 |
1.62 |
0.42 |
0.38 |
8.42 |
9.72 |
0.40 |
8.82 |
86.63 |
3.91 |
0.19 |
3.40 |
0.70 |
912.58 |
82.06 |
13.34 |
4.94 |
|
||||||||
|
44 |
ABU48 |
347215.256 |
1239162.14 |
5.80 |
1.32 |
0.50 |
0.42 |
8.04 |
9.54 |
0.60 |
8.64 |
84.28 |
4.40 |
0.22 |
2.60 |
0.70 |
433.50 |
93.18 |
13.42 |
8.56 |
|
||||||||
|
45 |
ABU49 |
347490.256 |
1239162.14 |
5.20 |
2.10 |
0.12 |
0.17 |
7.59 |
9.29 |
0.80 |
8.39 |
81.70 |
1.83 |
0.09 |
4.20 |
0.50 |
1162.58 |
209.26 |
13.56 |
5.66 |
|
||||||||
|
46 |
ABU50 |
347765.256 |
1239162.14 |
4.60 |
1.38 |
0.17 |
0.23 |
6.38 |
7.88 |
0.60 |
6.98 |
80.96 |
2.92 |
0.13 |
4.20 |
0.60 |
476.04 |
94.12 |
13.46 |
4.54 |
|
||||||||
|
47 |
ABU51 |
348040.256 |
1239162.14 |
5.00 |
1.80 |
0.48 |
0.34 |
7.62 |
8.72 |
0.20 |
7.82 |
87.39 |
3.90 |
0.18 |
3.40 |
0.50 |
545.86 |
106.48 |
13.64 |
5.86 |
|
||||||||
|
48 |
ABU52 |
346940.256 |
1239437.14 |
7.40 |
1.74 |
0.29 |
0.16 |
9.59 |
10.89 |
0.40 |
9.99 |
88.06 |
1.47 |
0.07 |
1.60 |
0.70 |
518.46 |
92.74 |
13.38 |
5.56 |
|
||||||||
|
49 |
ABU53 |
347215.256 |
1239437.14 |
3.80 |
1.56 |
0.28 |
0.22 |
5.86 |
7.16 |
0.40 |
6.26 |
81.84 |
3.07 |
0.13 |
3.60 |
0.30 |
633.00 |
131.46 |
14.28 |
5.22 |
|
||||||||
|
50 |
ABU54 |
347490.256 |
1239437.14 |
4.40 |
1.38 |
0.33 |
0.17 |
6.28 |
7.58 |
0.40 |
6.68 |
82.85 |
2.24 |
0.10 |
3.40 |
0.40 |
545.66 |
88.10 |
14.96 |
7.28 |
|
||||||||
|
51 |
ABU55 |
346940.256 |
1239712.14 |
4.60 |
1.50 |
0.19 |
0.15 |
6.44 |
7.94 |
0.60 |
7.04 |
81.11 |
1.89 |
0.09 |
2.20 |
0.80 |
279.80 |
73.18 |
0.28 |
1.84 |
|
||||||||
|
52 |
ABU56 |
347215.256 |
1239712.14 |
4.80 |
2.22 |
0.18 |
0.16 |
7.36 |
8.66 |
0.40 |
7.76 |
84.99 |
1.85 |
0.09 |
3.00 |
0.60 |
270.46 |
64.70 |
0.18 |
1.16 |
|
||||||||
APPENDIX C: AHP (Pairwise comparison table) FOR MAIZE
|
OBJECTID |
Layer name |
Texture |
Drainage |
Eff. depth |
Slope |
OC |
weight |
CI |
RI |
CR |
|
1 |
Texture |
1 |
2 |
2 |
3 |
2 |
0.328485 |
0.059618 |
1.12 |
0.053231 |
|
2 |
Drainage |
0.5 |
1 |
2 |
3 |
0.333 |
0.183888 |
0.059618 |
1.12 |
0.053231 |
|
3 |
Eff. depth |
0.5 |
0.5 |
1 |
2 |
0.5 |
0.133937 |
0.059618 |
1.12 |
0.053231 |
|
4 |
Slope |
0.333 |
0.333 |
0.5 |
1 |
0.333 |
0.079242 |
0.059618 |
1.12 |
0.053231 |
|
5 |
OC |
0.5 |
3 |
2 |
3 |
1 |
0.274448 |
0.059618 |
1.12 |
0.053231 |
APPENDIX D: AHP (Pairwise comparison table) FOR SORGHUM
|
OBJECTID |
layername |
Temperature |
Rainfall |
Texture |
Slope |
OC |
Effective Depth |
Drainage |
weight |
CI |
RI |
CR |
|
1 |
Temperature |
1 |
0.333 |
1 |
9 |
9 |
5 |
9 |
0.265746 |
0.106186 |
1.36 |
0.078078 |
|
2 |
Rainfall |
3 |
1 |
5 |
7 |
7 |
3 |
9 |
0.371338 |
0.106186 |
1.36 |
0.078078 |
|
3 |
Texture |
0.143 |
0.2 |
1 |
3 |
3 |
0.333 |
5 |
0.085185 |
0.106186 |
1.36 |
0.078078 |
|
4 |
Slope |
0.111 |
0.143 |
0.333 |
1 |
3 |
0.2 |
5 |
0.058726 |
0.106186 |
1.36 |
0.078078 |
|
5 |
OC |
0.111 |
0.143 |
0.333 |
0.333 |
1 |
0.2 |
3 |
0.037584 |
0.106186 |
1.36 |
0.078078 |
|
6 |
Effective Depth |
0.2 |
0.333 |
3 |
5 |
5 |
1 |
7 |
0.159865 |
0.106186 |
1.36 |
0.078078 |
|
7 |
Drainage |
0.111 |
0.111 |
0.2 |
0.2 |
0.333 |
0.143 |
1 |
0.021557 |
0.106186 |
1.36 |
0.078078 |
APPENDIX E: AHP (Pairwise comparison table) FOR SOYBEAN
|
OBJECTID |
layer name |
drainage |
OC |
pH |
Slope |
weight |
CI |
RI |
CR |
|
1 |
drainage |
1 |
4 |
3 |
2 |
0.46585 |
0.010185 |
0.89 |
0.011444 |
|
2 |
OC |
0.25 |
1 |
0.5 |
0.333 |
0.095955 |
0.010185 |
0.89 |
0.011444 |
|
3 |
Ph |
0.333 |
2 |
1 |
0.5 |
0.161039 |
0.010185 |
0.89 |
0.011444 |
|
4 |
Slope |
0.5 |
3 |
2 |
1 |
0.277156 |
0.010185 |
0.89 |
0.011444 |
APPENDIX F: AHP (Pairwise comparison table) FOR COWPEA
|
OBJECTID |
layer name |
Rainfall |
Temperature |
Slope |
Eff.depth |
weight |
CI |
RI |
CR |
|
1 |
Rainfall |
1 |
2 |
5 |
2 |
0.44709 |
0.096395 |
0.89 |
0.108309 |
|
2 |
Temperature |
0.5 |
1 |
3 |
2 |
0.272417 |
0.096395 |
0.89 |
0.108309 |
|
3 |
Slope |
0.2 |
0.333 |
1 |
2 |
0.142191 |
0.096395 |
0.89 |
0.108309 |
|
4 |
Eff.depth |
0.5 |
0.5 |
0.5 |
1 |
0.138302 |
0.096395 |
0.89 |
0.108309 |
APPENDIX G: Spatial Distribution of soil properties in ABU Farm, Shika


(a) Spatial Distribution of AP (b) Spatial Distribution of Exch. Ca


(c) Spatial Distribution of CEC (d) Spatial Distribution of Exch. Mg


(e) Spatial Distribution of Exch. Na (f) Spatial Distribution of SAR


(g) Spatial Distribution of TN (h) Spatial Distribution of Temperature


(i) Spatial Distribution of BSP (j) Spatial Distribution of ECe


(k) Spatial Distribution of ESP (l) Spatial Distribution of OC


(m) Spatial Distribution of rainfall (n) Spatial Distribution of Stoniness


(o) Spatial Distribution of ESD (p) Spatial Distribution of Slope
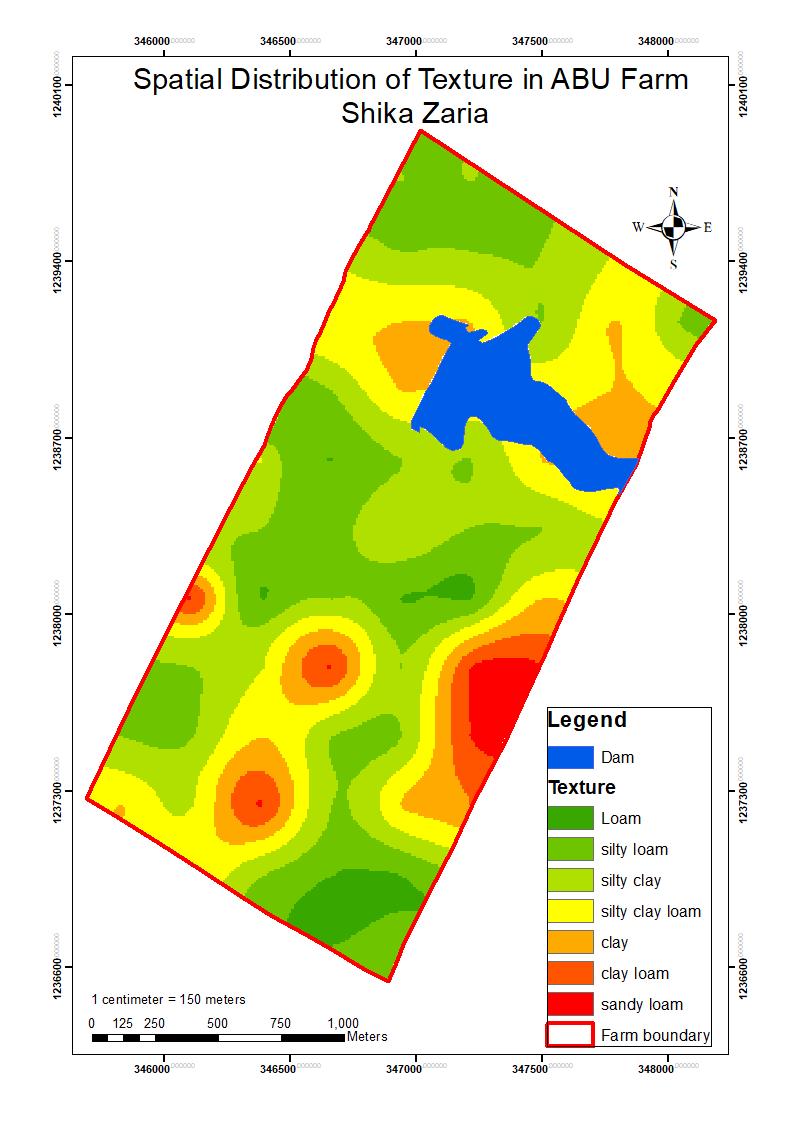

(q) Spatial Distribution of Texture (r) Spatial Distribution of Exch K


(s) Spatial Distribution of Drainage (t) Spatial Distribution of pH


(u) Spatial Distribution of Cu (v) Spatial Distribution of Fe


(w) Spatial Distribution of Mn (x) Spatial Distribution of Zn
APPENDIX H: Team Composition
Specialists/ Experts
1. Prof. Nafiu Abdu Deputy Director / Project Leader (Quality Assurance)
2. Prof. Yau S.L. Pedologist/Soil Surveyor, Land Use Planning.
3. Dr Maniyunda, L. M . : Pedologist/ Soil Surveyor, Land Use Planning.
4. Dr. Shobayo, A.B. Pedologist/ Soil Surveyor, Land Use Planning.
5. Dr Jamila Aliyu Pedologist/ Soil Surveyor, Land Use Planning
6. Mrs Ummusalma S.Z. Pedologist/ Soil Surveyor, Land Use Planning
7. Mr. Bitrus Kantiyok Technical staff (Infiltration)
8. Mr Abdulazeez Ridwan Technical staff (Infiltration)
9. Mr. Jamilu Ilyasu Field Assistant
10. Mr Umar Lawal Field Assistant
11. Mal. Adamu Abubakar Driver
APPENDIX I: Acknowledgment
We sincerely appreciate the Executive Director of the Institute for Agricultural Research (IAR), Prof. Ado Yusuf, for his visionary leadership in initiating and sponsoring the Land Evaluation of the IAR and ABU Research Farms. This project would not have been possible without his unwavering support and commitment to advancing agricultural research and development.
We extend our heartfelt gratitude to the Institute for Agricultural Research (IAR) for providing the resources and enabling environment for the successful execution of this project.
We are deeply indebted to the Head of the Department of Soil Science (Prof. Aisha Abdulkadir) whose guidance and encouragement were invaluable throughout the course of this work. Our appreciation also goes to the participating scientists for their expertise and dedication, which greatly contributed to the success of this endeavour.
We are equally grateful to the technical staff for their diligence and tireless efforts in the field and laboratory. Special recognition is given to the team in the soil analysis laboratory, whose meticulous analysis of the soil samples played a critical role in achieving the objectives of this project.
Finally, we thank everyone who, in one way or another, contributed to the successful completion of this important work. Your collective efforts have not only enriched our understanding of the research farms but also laid a solid foundation for future advancements in agricultural research.
S.L. Ya’u
On behalf of the team